About Mimir | Asgard Data Insight
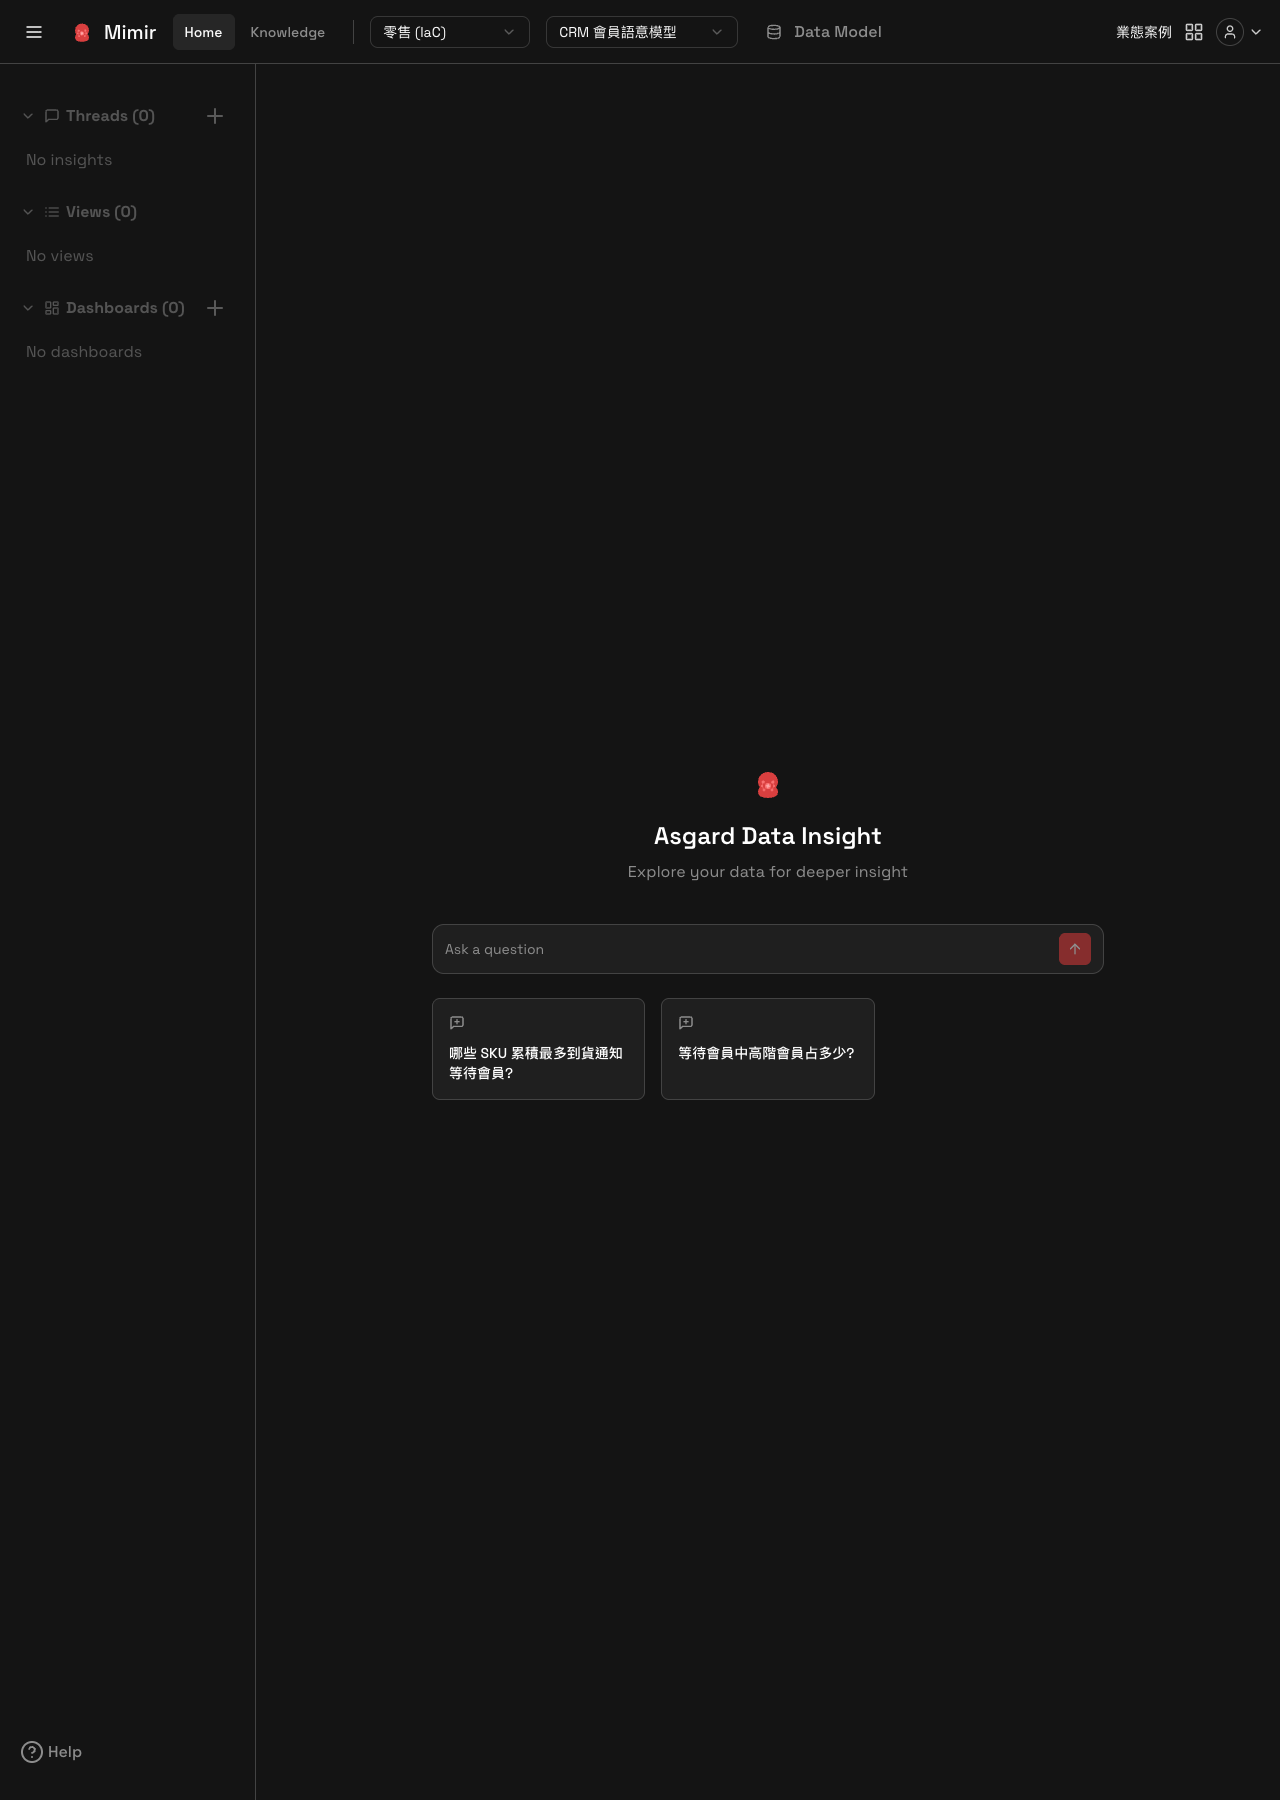
Mimir is the Asgard platform's data insight tool, branded Asgard Data Insight in the product. You do not need to know SQL. Ask a business question in natural language and Mimir works out which tables to query, writes and validates the SQL, fetches the data, and returns an answer with a conclusion attached.
The difference from a conventional BI tool is the entry point. BI usually requires someone to build a report before anyone can look at it. In Mimir you ask the question first, get the answer, and only then, if the answer is worth tracking over time, save it as a chart and put it on a dashboard.
Core concepts
- Project: the project switcher at the top decides which set of business data you are querying. Switching it changes everything in the sidebar. A single Workspace can hold several Projects covering different lines of business.
- Semantic Model: the dropdown next to the project switcher decides which semantic model this question queries. A semantic model describes what columns a table has, what each column means, and which measures are available. It is what allows Mimir to translate natural language into correct SQL. The retail sample project has several mounted at once, covering CRM membership, ERP, e-commerce, POS store data, suppliers, the data warehouse (OLAP) and the WMS distribution centre. Semantic models themselves are created and published in Odin | Asgard Studio.
- Thread: one question plus any follow-ups forms a Thread, listed in the sidebar's Threads section. See Asking questions in a Thread.
- View: saves one query's result together with its SQL and its chosen presentation, producing a reusable chart. See View.
- Dashboard: arranges several Views on one page as a board for ongoing tracking. See Dashboard.
- Knowledge: the Knowledge tab at the top, where your organisation's own query conventions and answering rules accumulate so that Mimir's SQL and its answers match what you expect. See Knowledge.
A typical session
- Pick the Project and the semantic model you want to query.
- Type a question into the box on the home screen. Mimir creates a Thread and starts querying.
- Read the conclusion and the data table. When you need detail, open Data Model to check a column's definition.
- If the result is worth keeping, save it as a View.
- Put related Views on the same Dashboard, then track them from the board instead of re-asking each time.