Case study: finding the stores that can transfer stock
Store stockout to inter-store transfer looks at how an administrator builds the transfer Agent, from Odin's side. The Sindri version looks at how a business user approves the transfer orders in a chat window. This page looks at the step before either decision: how stock is actually distributed across the chain, and which stores can genuinely spare any.
信義旗艦店 (Xinyi Flagship) runs out of the 聯名鈦保溫瓶 (co-branded titanium flask) tomorrow. Any transfer requires knowing who has headroom first, and that answer is spread across the inventory data of a dozen stores. The retail project's POS store semantic model holds it, including on-hand stock, safety stock and average daily sales for every product in every store.
One question for the whole chain's stock distribution
The operations user selects the POS store semantic model on the Mimir home screen and types:
What is the on-hand and safety stock of the 聯名鈦保溫瓶 at each store? Which stores are above safety stock and have surplus to transfer? Show on-hand stock per store as a bar chart
Asking for a bar chart in the question is what makes Mimir draw one. Without that it returns prose and a table only. After submitting, it ran seven steps: query the available semantic models, understand the inventory table's structure and columns, validate the query, fetch on-hand and safety stock per store, build the table, name the conversation, and finally draw the chart.
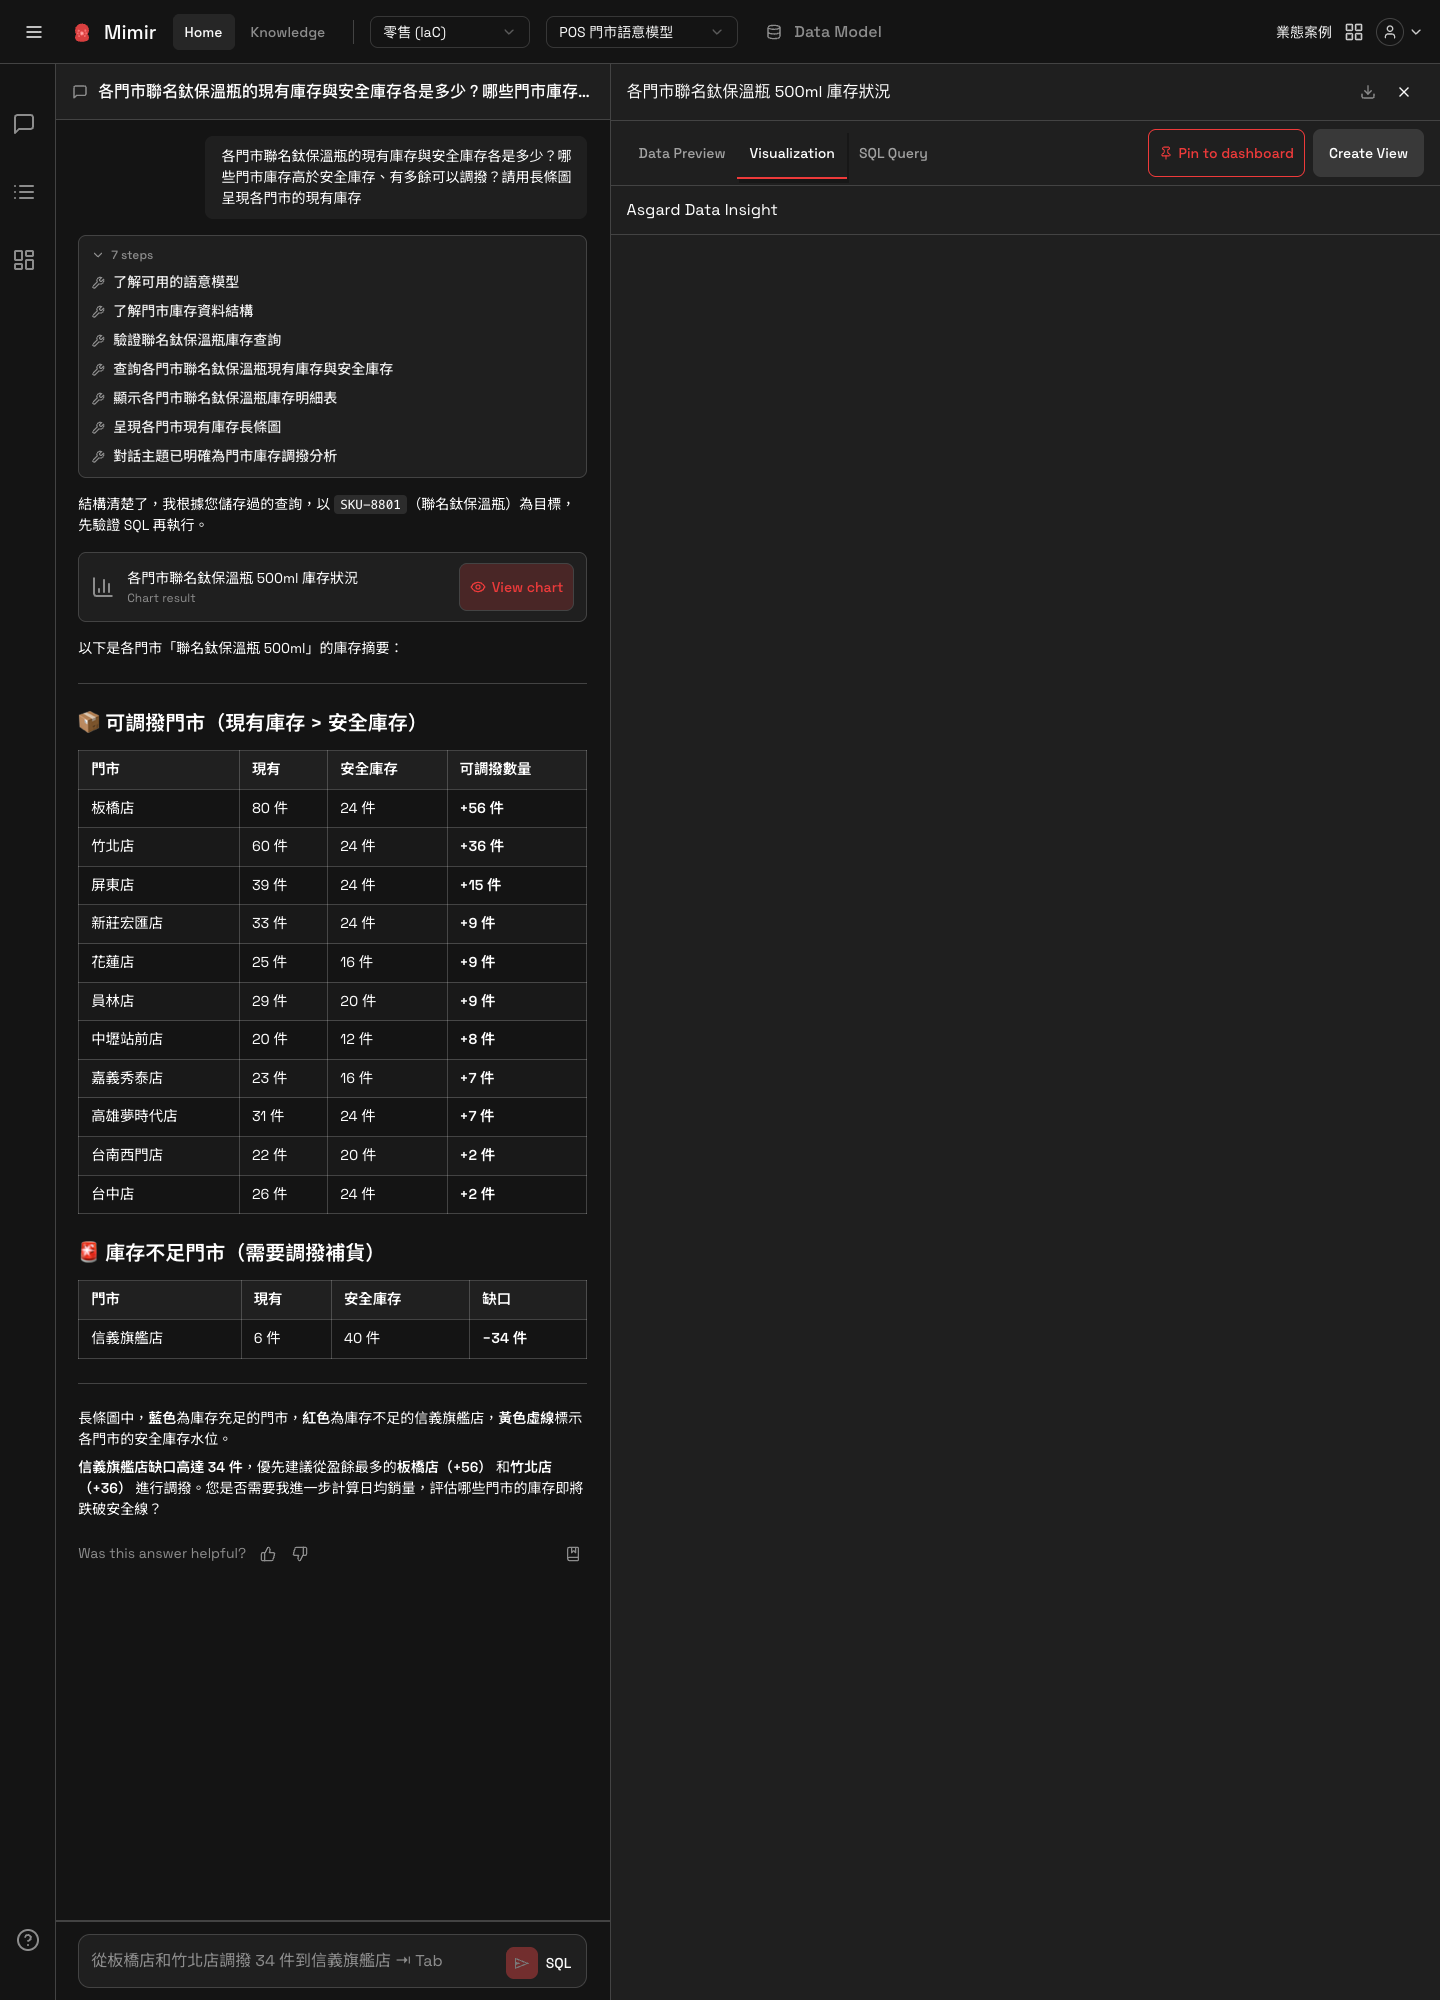
The answer splits the stores into two groups. Stores with surplus number 11. 板橋店 (Banqiao) has 80 units on hand against 24 safety stock, a surplus of 56, the largest. 竹北店 (Zhubei) has 60 against 24, a surplus of 36, second. 屏東店 (Pingtung) has a surplus of 15. Others, such as 新莊宏匯店 (Xinzhuang), 花蓮店 (Hualien) and 員林店 (Yuanlin), have around 9 each, while 台南西門店 (Tainan Ximen) and 台中店 (Taichung) have only 2 units of headroom left. Stores that are short number one: 信義旗艦店 has 6 units on hand against 40 safety stock, a shortfall of 34.
Mimir also gave a recommendation directly: transfer from 板橋 (surplus 56) and 竹北 (surplus 36) first to cover 信義旗艦店's shortfall of 34, since the two together have 92 units of surplus and ample room. This is where the three transfer orders actually issued in the Odin case study come from.
Reading the distribution off the chart
Click View chart on the result card to open the panel on the right, and switch to the Visualization tab for the bar chart.
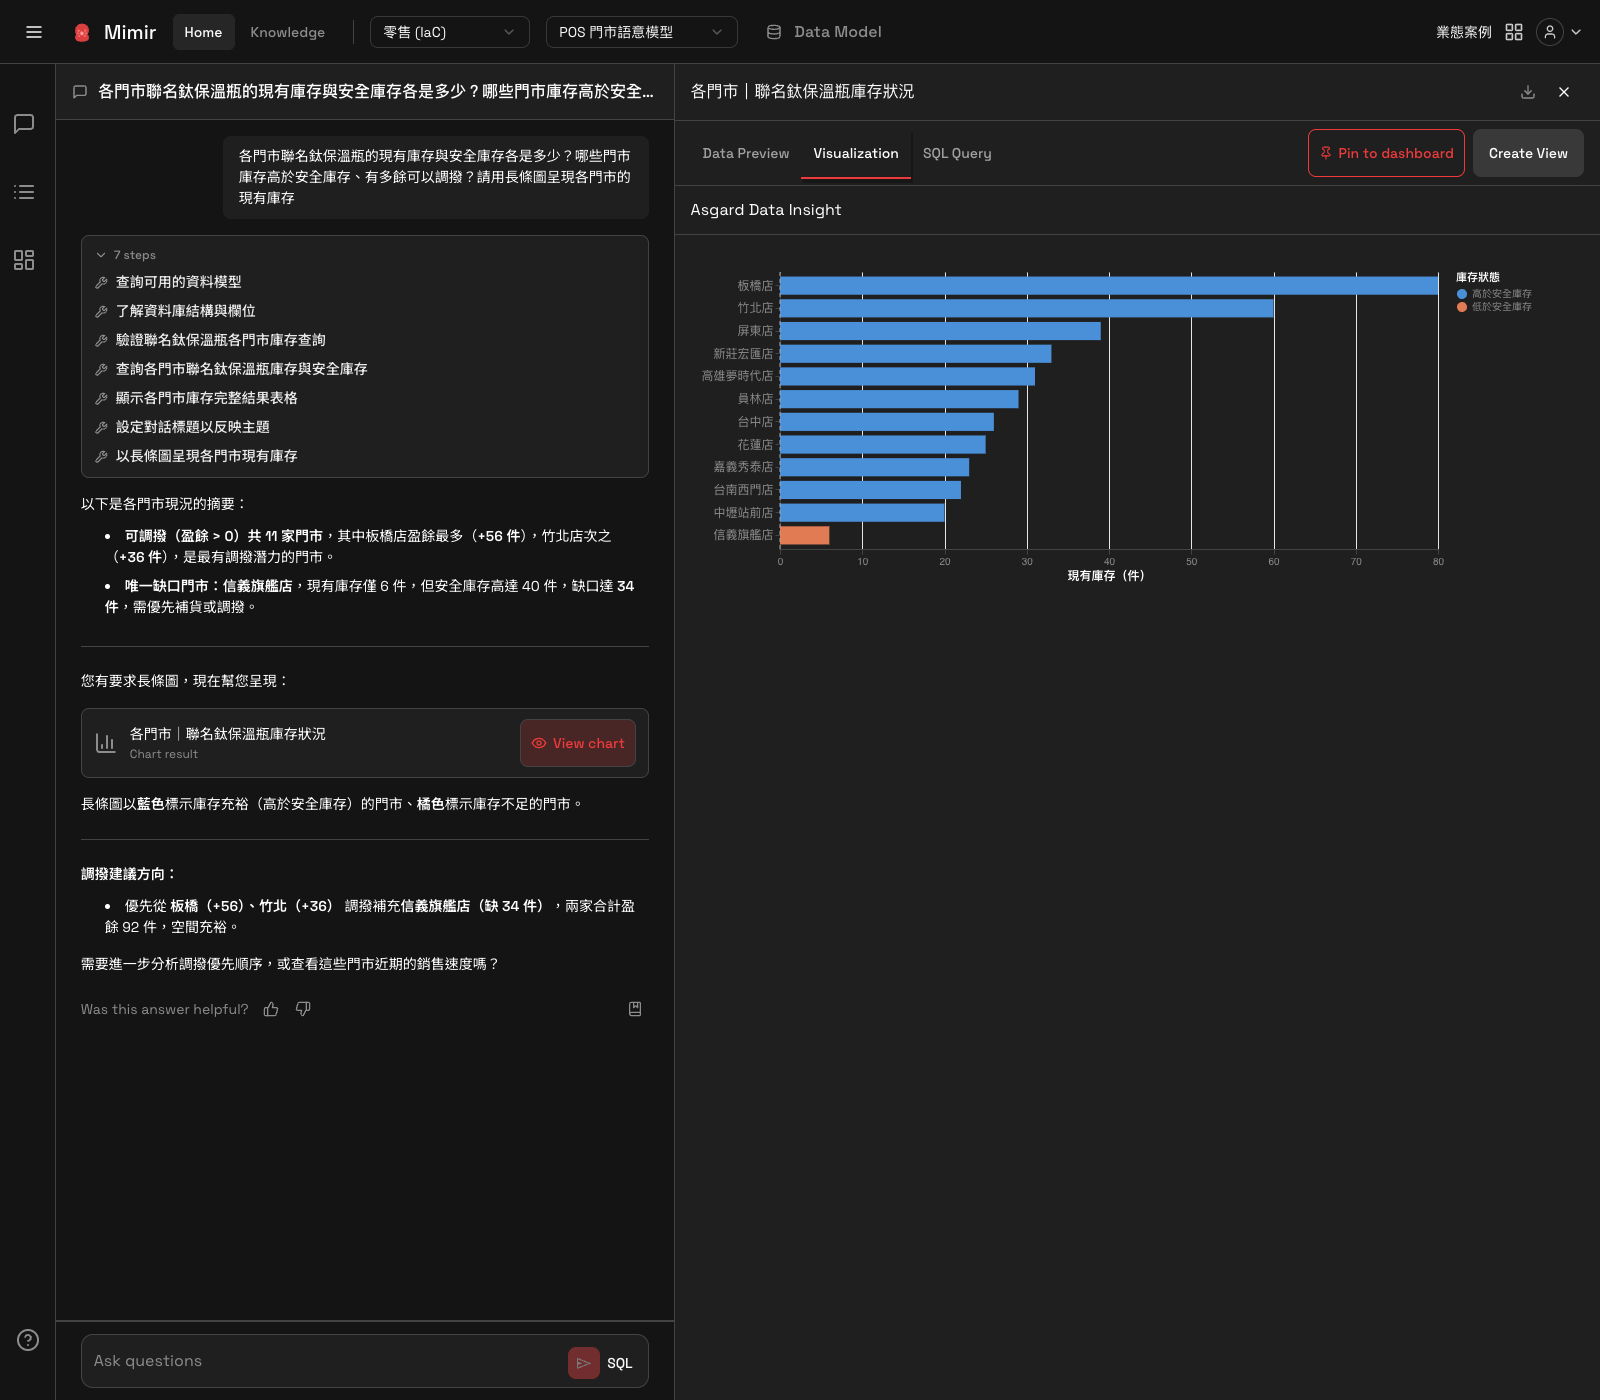
Colour tells the whole story: blue is a store above its safety level, and there is only one orange bar, 信義旗艦店, the one that is short. The bars run longest to shortest, so it is immediately clear that the headroom concentrates in 板橋 and 竹北. The stores after them have surplus in single digits, and splitting the transfer across seven or eight stores would only add logistics cost without gaining much quantity.
The panel's SQL Query tab shows the query Mimir generated, and Data Preview shows the raw rows.
Saving it as a chart for ongoing tracking
Stock changes daily during a stockout, so this is not a one-off question. Click Create View in the panel, set Visualization to that bar chart in the Save current view dialog, name it and save.
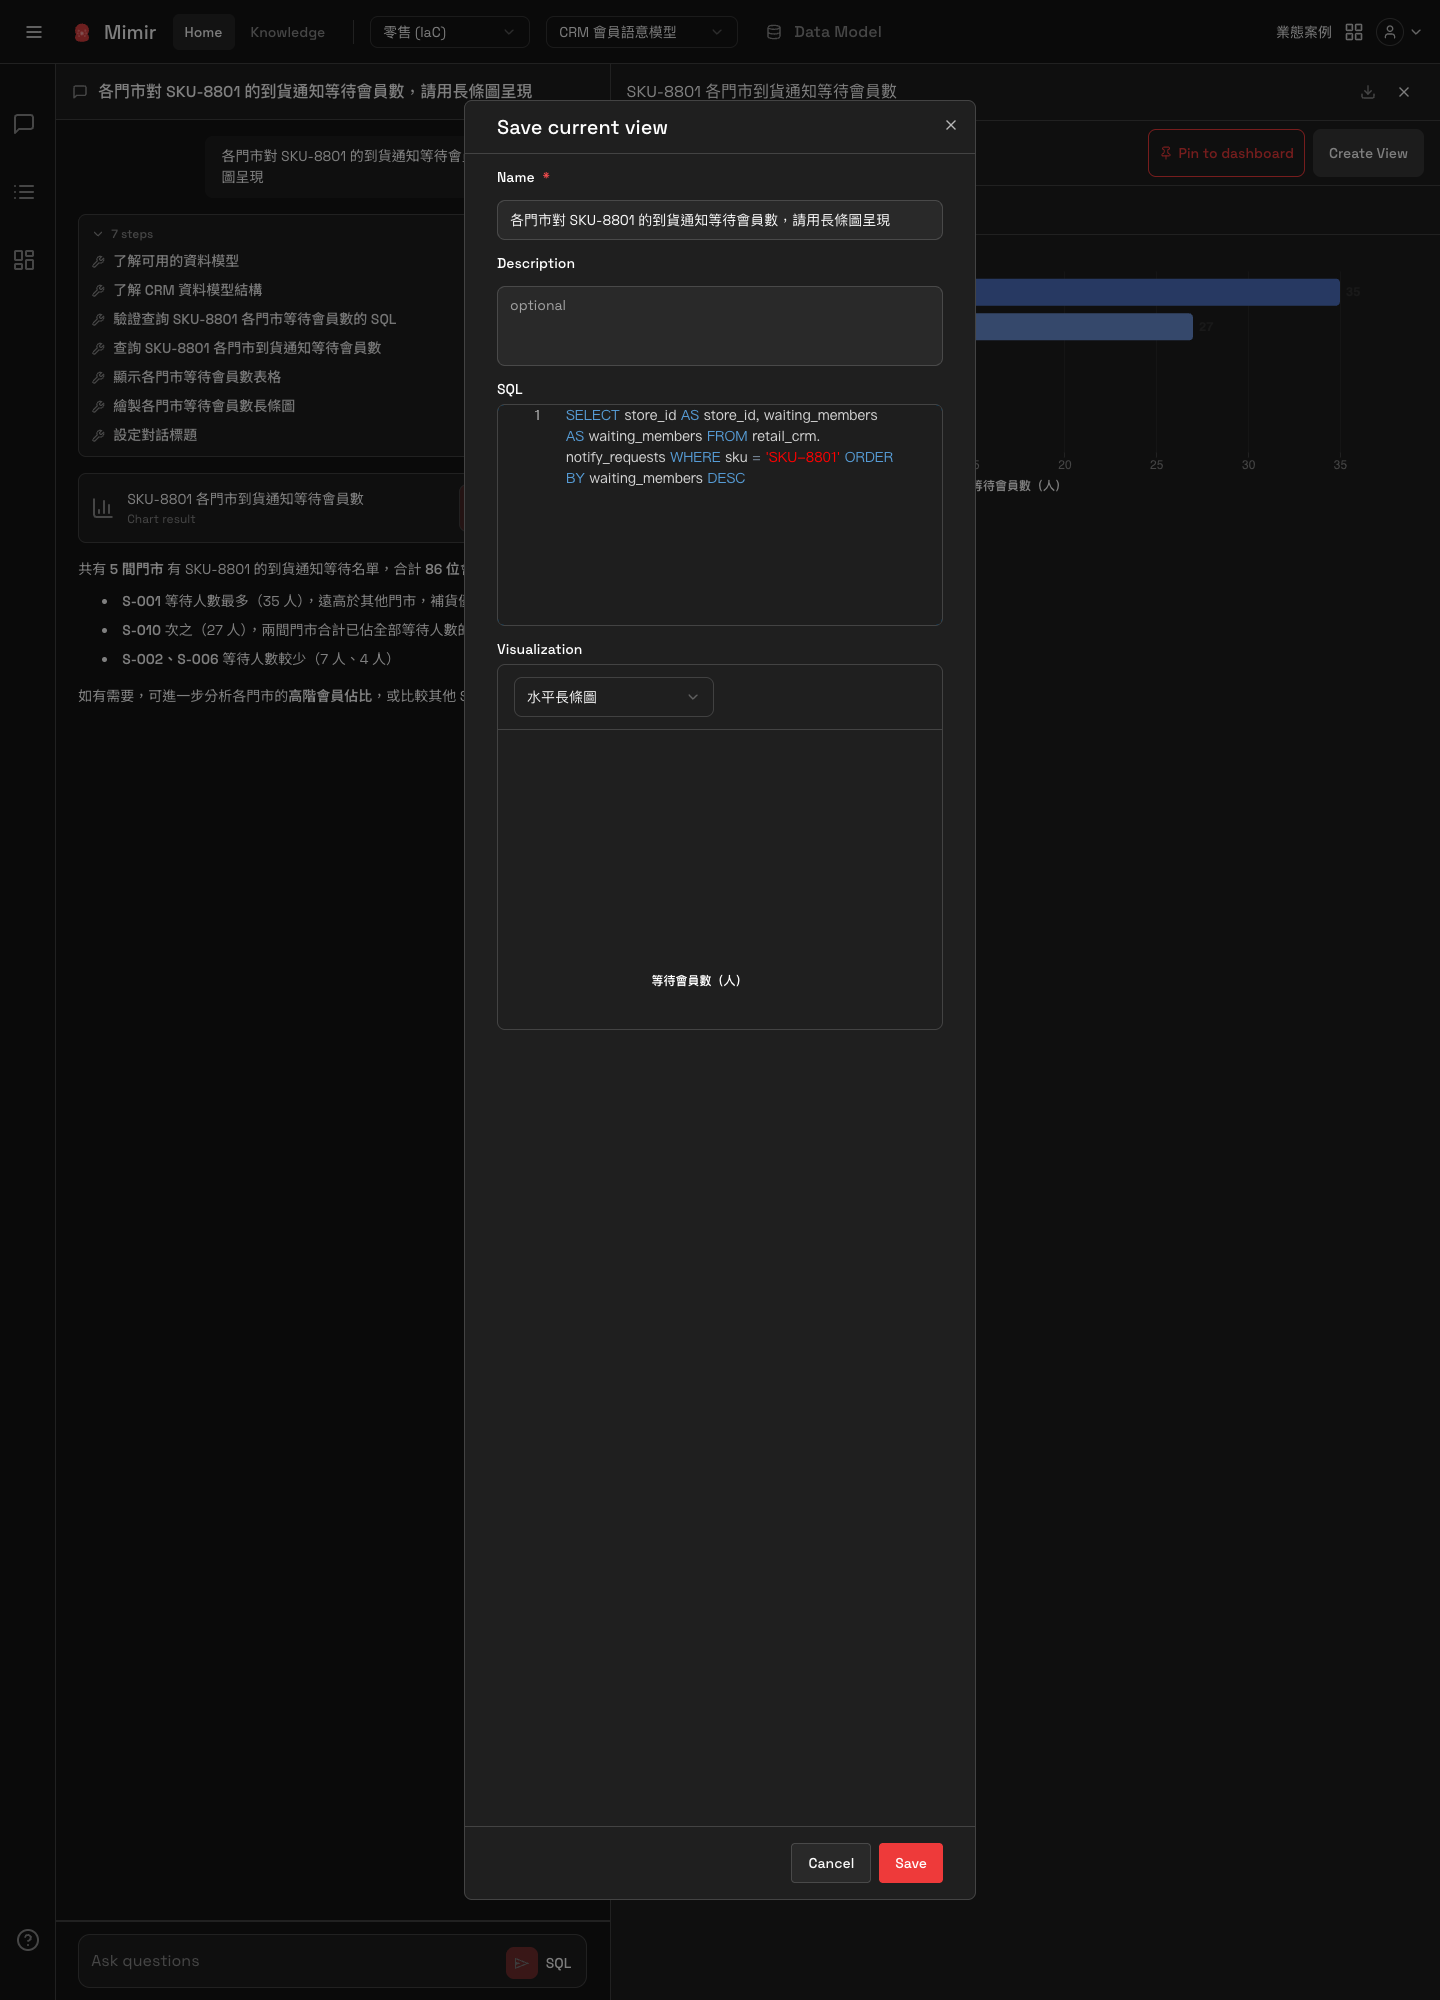
The saved View includes the SQL behind it, so it can go onto a dashboard alongside other stockout-tracking metrics and be read from the board afterwards. See Dashboard.
Keeping answers consistent with team conventions
That question worked first time on one condition: store_inventory carries both store_id and store_name, and both sku and sku_name, and which two columns to subtract for a shortfall is not something the data decides. Once those conventions are written into Knowledge, Mimir applies them when answering and they no longer have to be restated in each question. In this case it said so at the start of its reply: it followed a saved query, targeting SKU-8801, validating the SQL before running it.
What this case shows
- Knowing that 信義旗艦店 is 34 units short is not enough to decide how to refill it. The real question is which stores can spare stock, and the answer here is that 11 stores have surplus, but 板橋 and 竹北 alone account for 92 units, the remaining nine add up to under 60, and most are in single digits. So the sensible move is those two. Splitting the transfer across seven or eight stores only adds logistics cost.
- If you want a chart, write "bar chart" into the question. Without that Mimir returns prose and a table, and the only presentations available when saving a View are the charts it actually drew.
- Numbers that change daily should not be re-asked daily. Save a View, put it on a Dashboard, and open the board for the latest figures. Keep one-off exploration in a Thread.
- A shortfall being safety stock minus on-hand, and stores being shown by name rather than code, are team conventions. The data will not tell Mimir either of them. Written into Knowledge, they are applied every time, without being repeated in every question.