Asking questions in a Thread
A Thread is one data conversation in Mimir. Type a question into the box in the centre of the project home screen and submit it, and a new Thread is created and listed under the sidebar's Threads section. The number after Threads is how many conversations this project currently has.
Before submitting, check that the semantic model selected at the top is the right one. Mimir only queries within the selected model. Ask about a subject the model does not cover and it will say plainly that the data at hand cannot answer the question, then list what this model can actually answer, rather than forcing an answer.
What an answer is made of
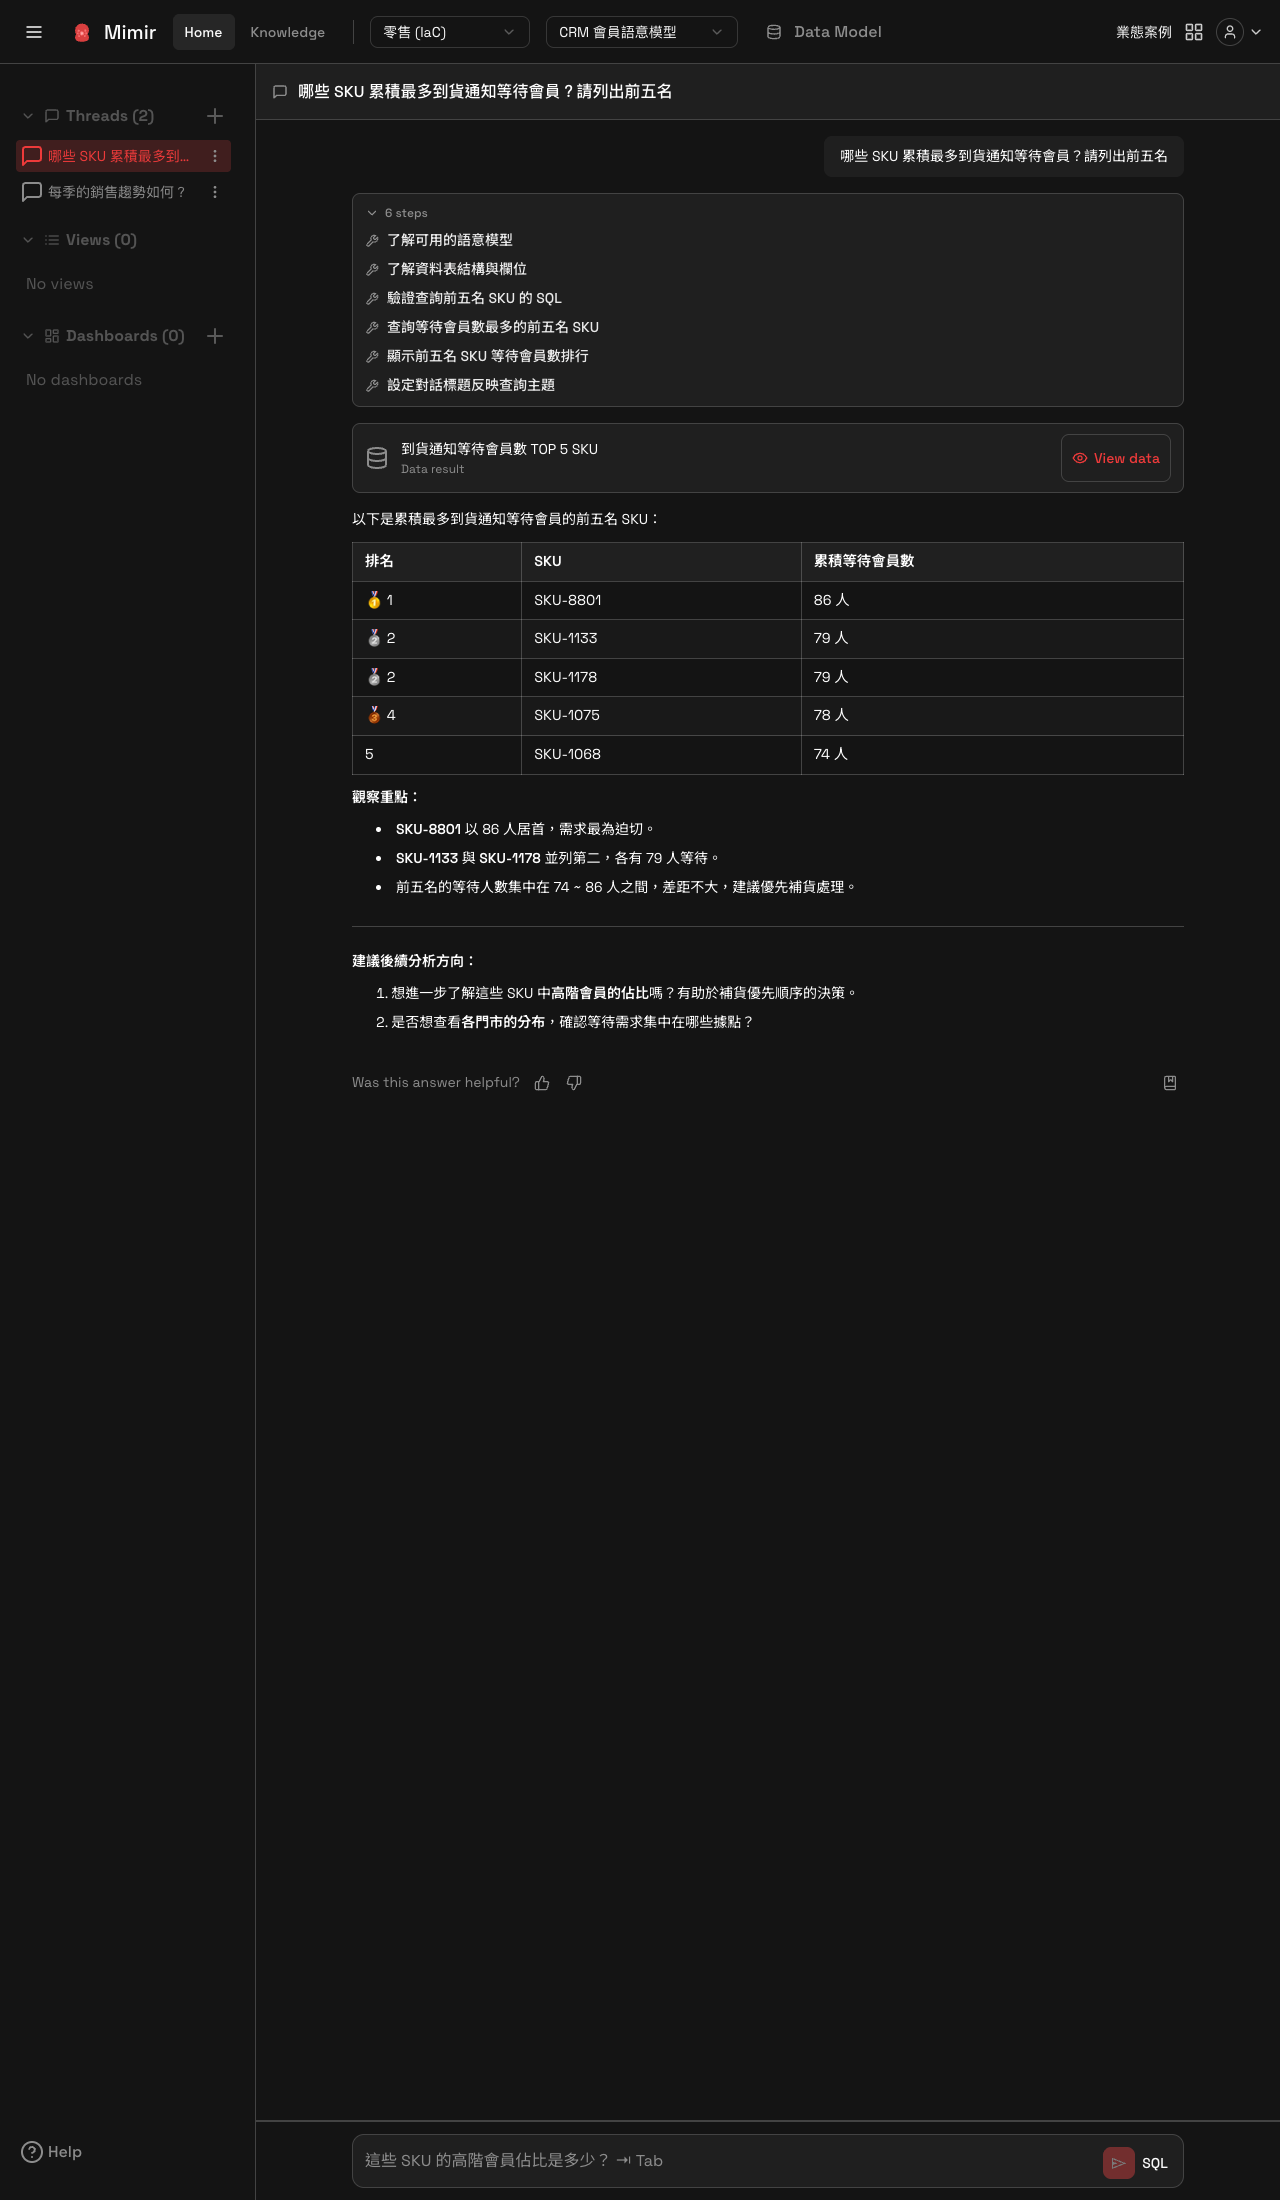
An answer has several parts:
- Execution steps: an expandable list at the top spelling out what Mimir actually did, for example understanding the available semantic models, understanding the table structure and columns, validating the query SQL, running the query, building the ranking, and naming the conversation. The number of steps varies with the complexity of the question.
- Conversation title: Mimir names the Thread after the subject of the query, replacing the original question text in the sidebar.
- Result card: the data this query actually returned. When the answer is a table only, the card reads Data result and the button is View data. When the answer includes a chart Mimir drew, the card reads Chart result and the button is View chart.
- Conclusion and observations: prose and a data table, usually including a few key observations rather than just dumping the query output.
- Follow-up suggestions: next questions Mimir proposes on its own, which you can ask directly.
- Feedback: the end of the answer asks whether it was helpful.
The question box at the bottom continues the same Thread, and Mimir carries the earlier context forward.
Each Thread in the sidebar has a menu offering Rename and Delete.
Viewing the raw data, the chart and the SQL
Click View data or View chart on the result card and the result panel for this query opens on the right.
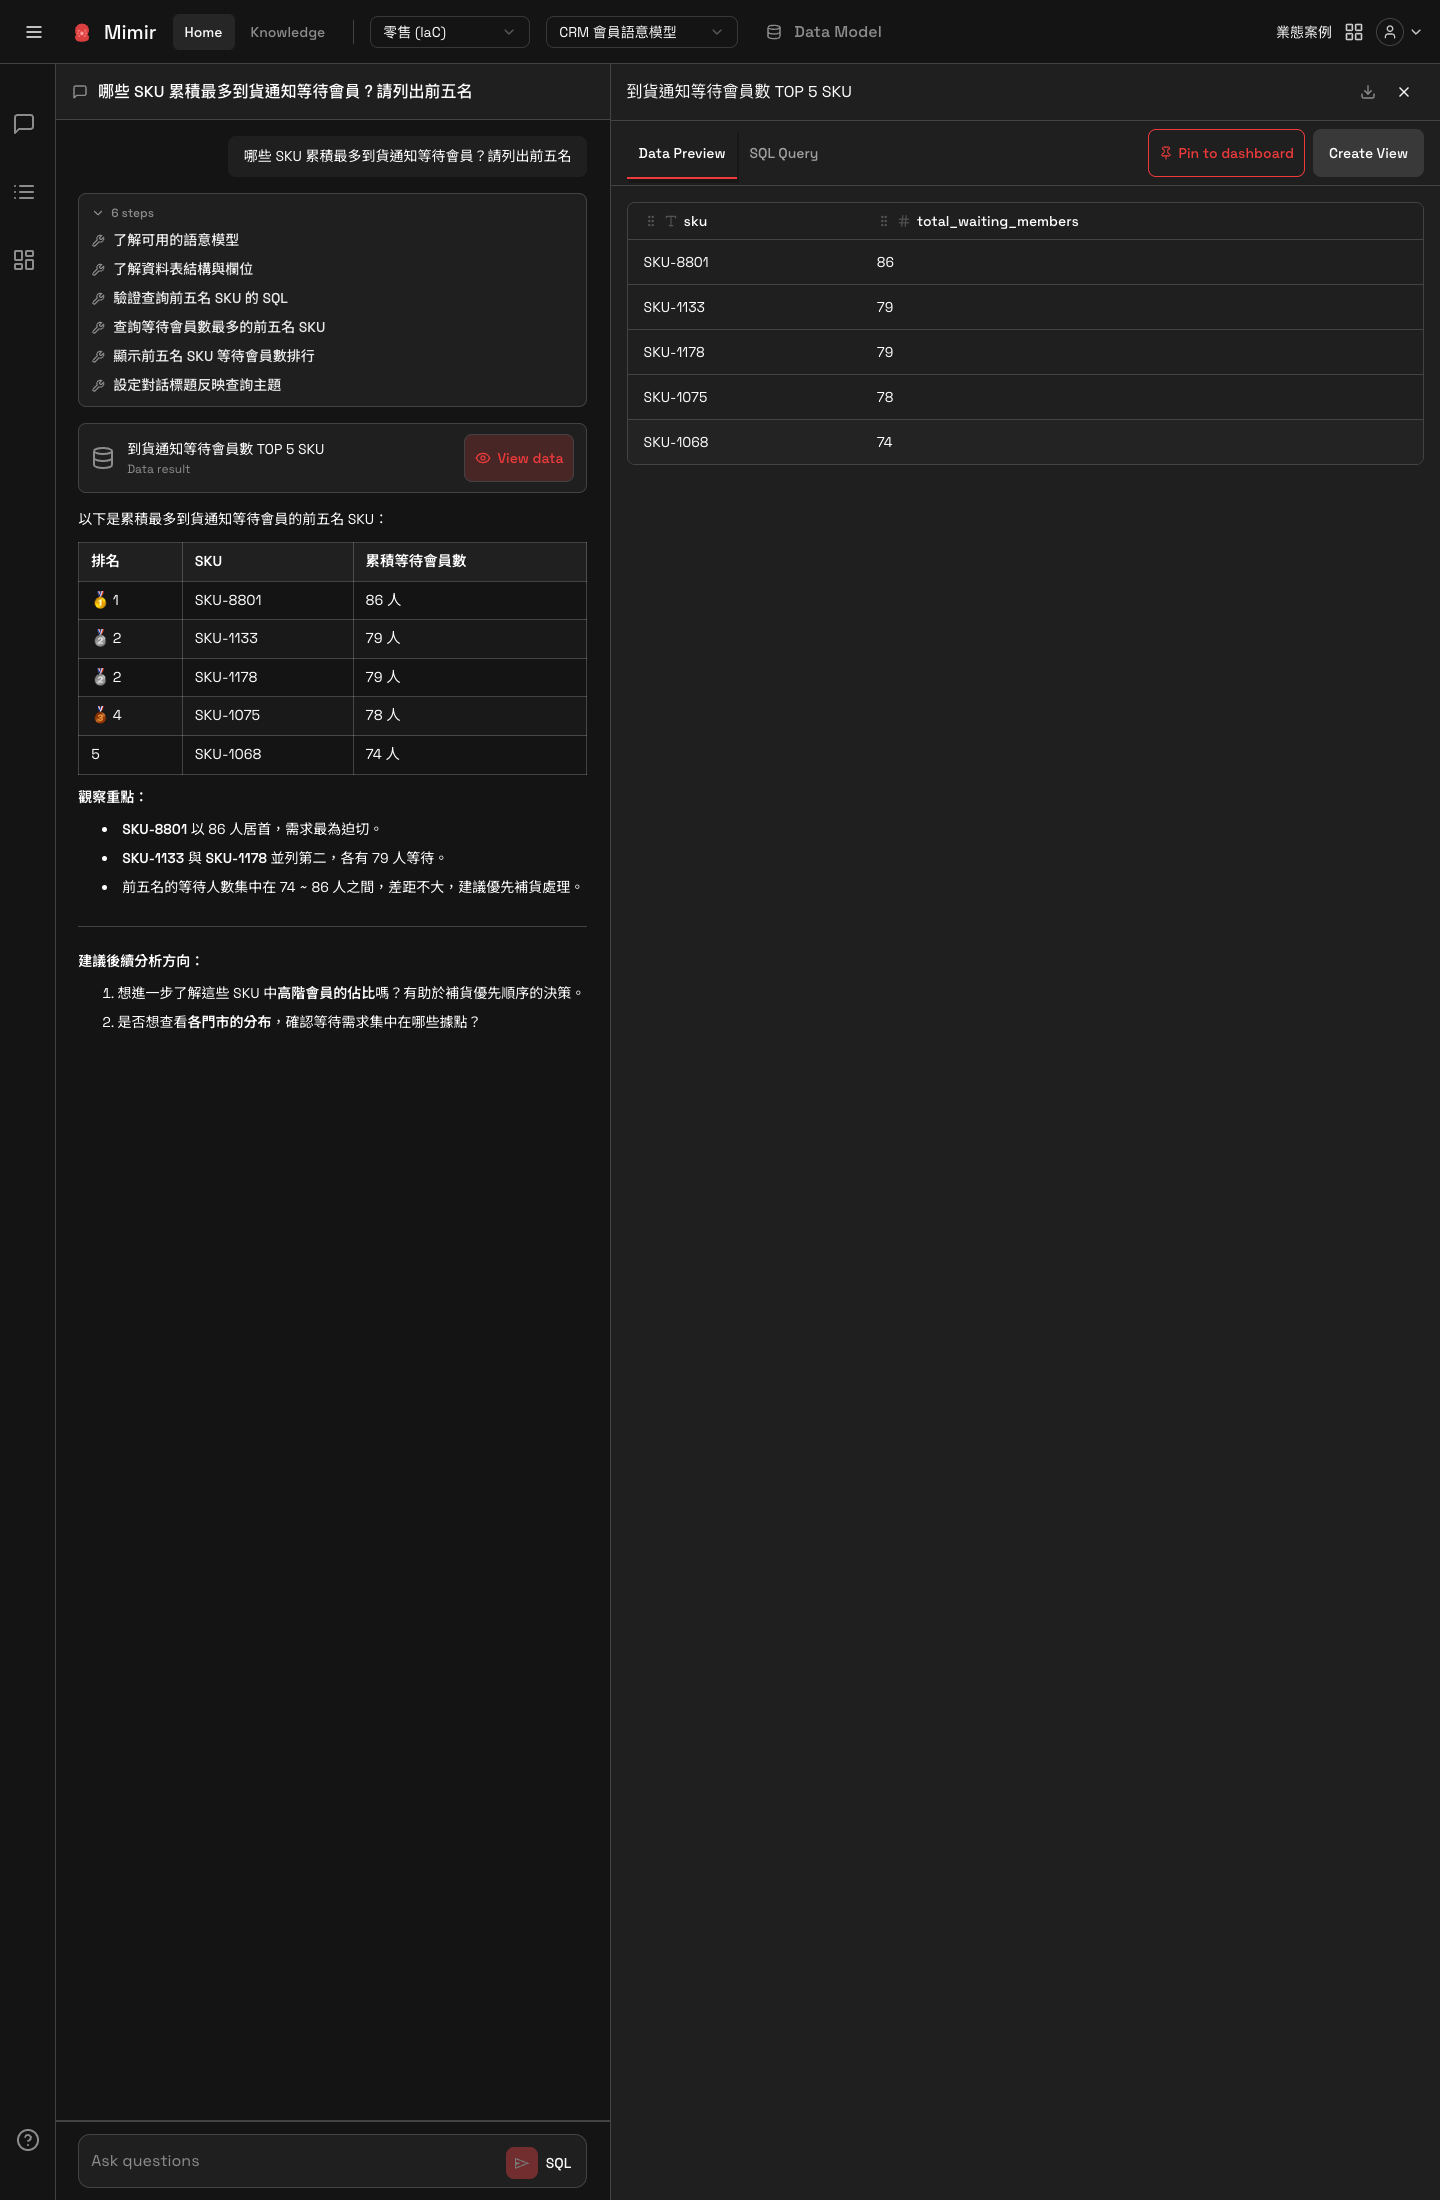
Which tabs the panel has depends on whether a chart was drawn:
- Data Preview: the table the query returned, with the database's original column names.
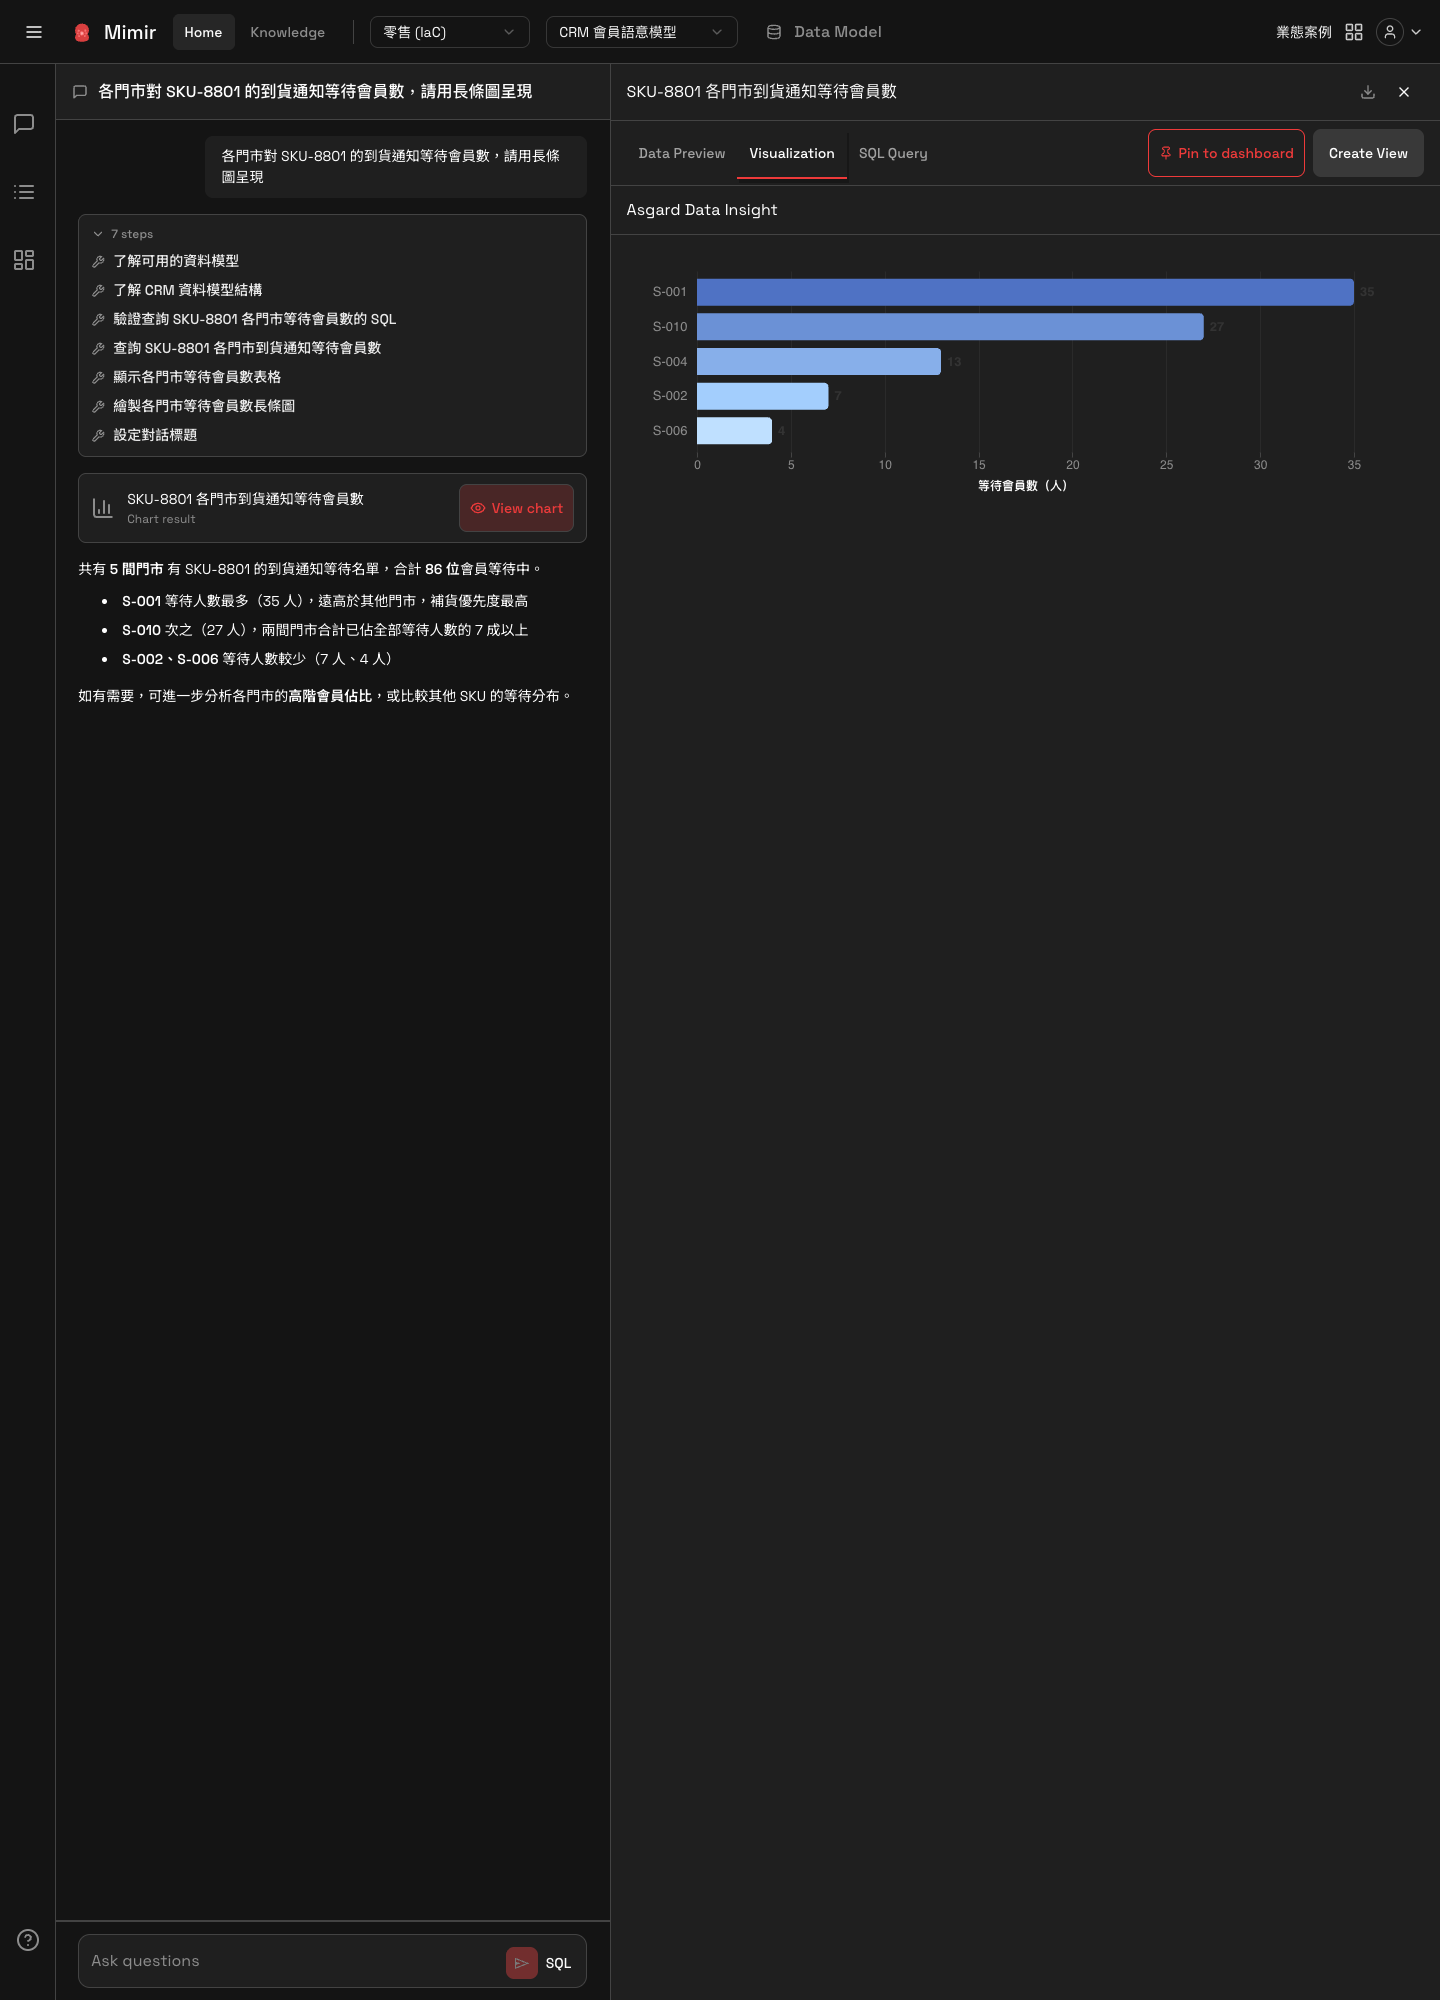
- Visualization: the chart Mimir drew. It appears only when this answer produced one.
- SQL Query: the SQL Mimir wrote for this question.
Two actions sit in the top right of the panel:
- Create View: saves this query result as a reusable chart. See View.
- Pin to dashboard: puts the result straight onto a dashboard, without saving it as a View first.
Getting Mimir to draw a chart
Mimir does not draw a chart every time. By default it returns a written conclusion plus a data table. If you want a chart, say so in the question, for example by asking for a bar chart. The answer's execution steps then include a chart-drawing step, and the result card becomes Chart result.
SQL editor
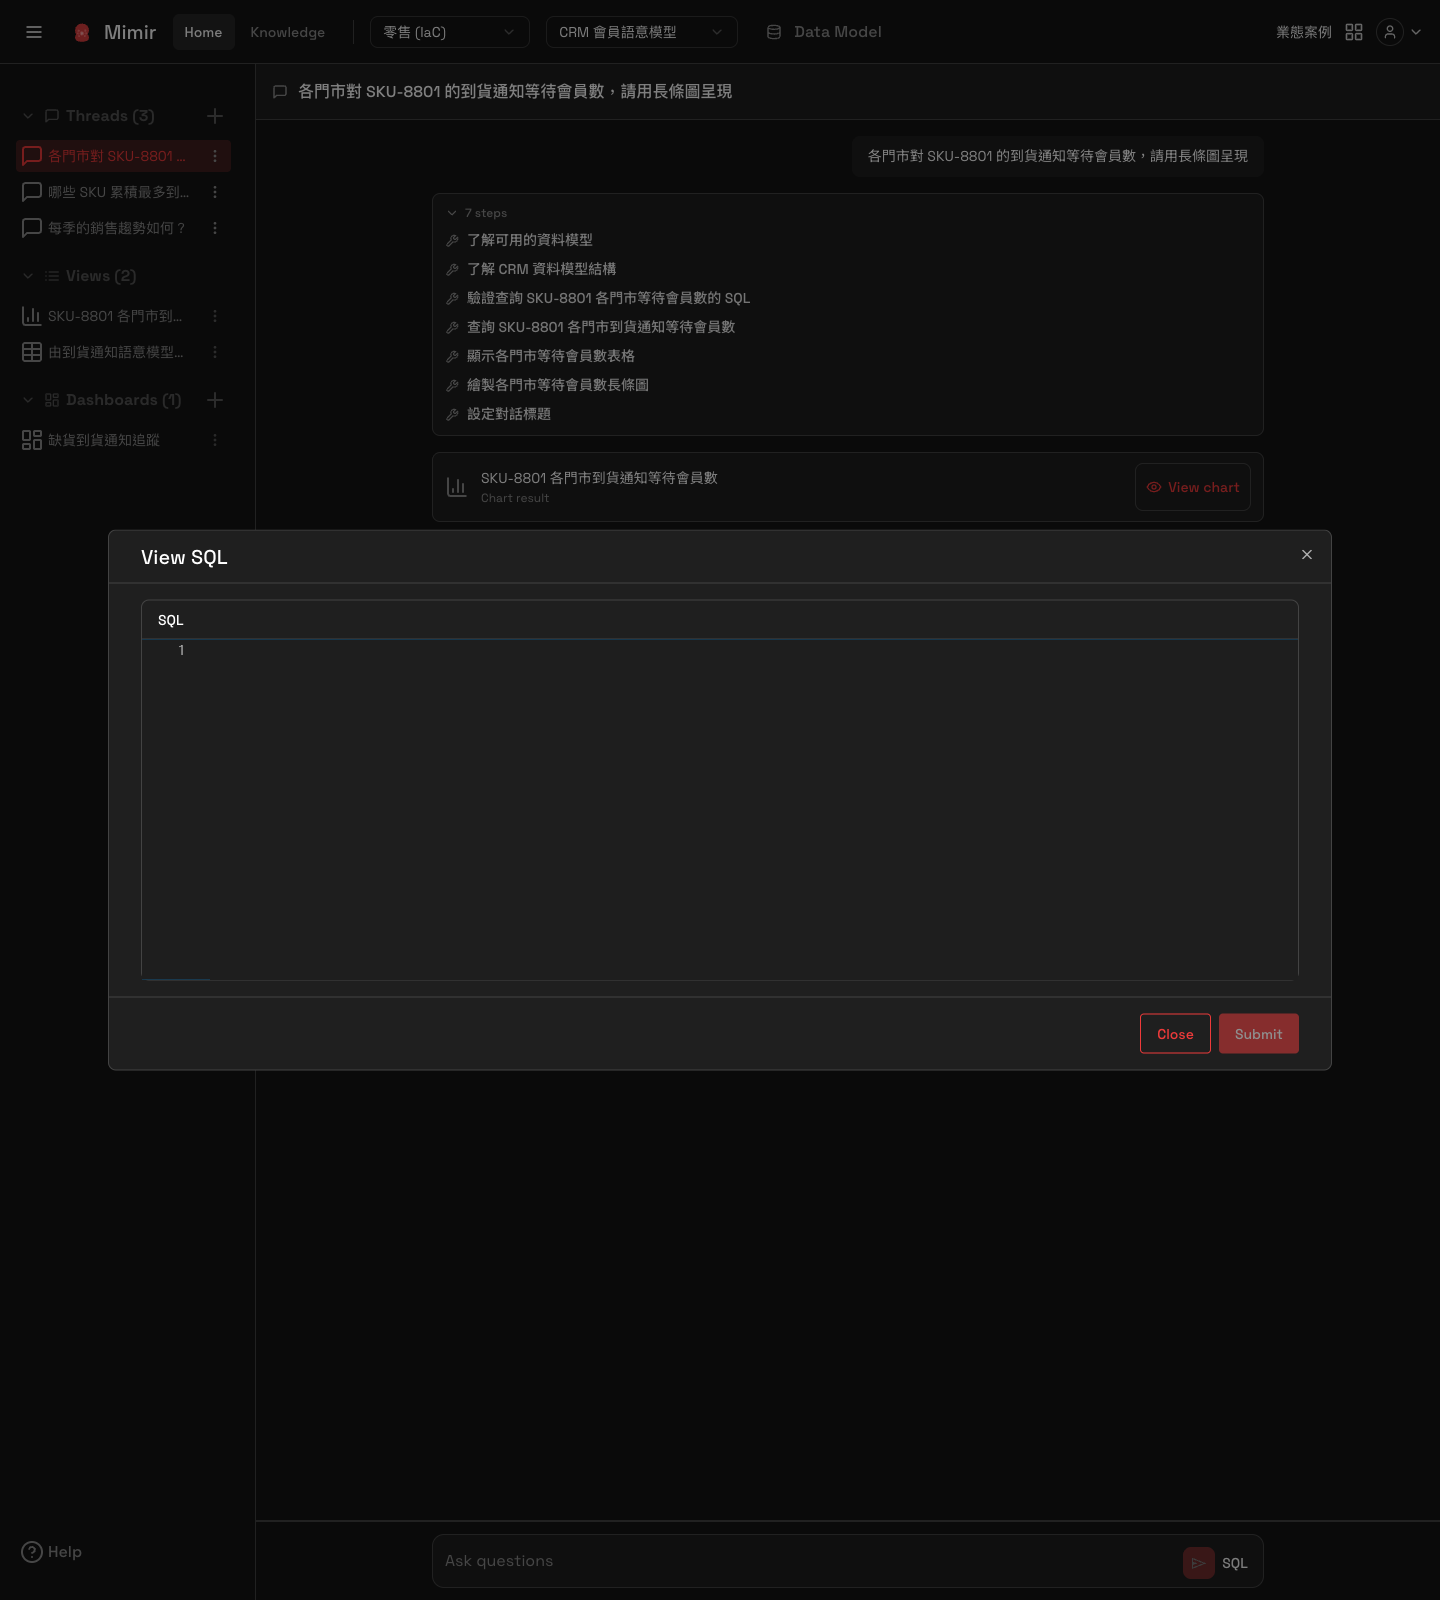
The SQL button to the right of the question box opens the SQL editor. Write or edit a query there and press Submit to run it. This suits cases where you already know what to query and want precise control over the conditions. Inside the editor, View SQL shows the statement Mimir generated for comparison.
Checking a column's definition
If you are unsure what a column in the answer actually represents, the Data Model button at the top opens the structure of the current semantic model, including each column's description and the available measures. See Data Model.