View
A View is a saved chart built from one query result. What gets saved is not only the numbers you were looking at but also the SQL that produced them and the presentation you chose, so it can be reused and placed on a dashboard.
A Thread is the process of exploring. A View is what you keep once the exploring is done.
Creating a View from a query
In a Thread answer, click View data on the Data result card, then Create View in the top right of the panel. The Save current view dialog opens.
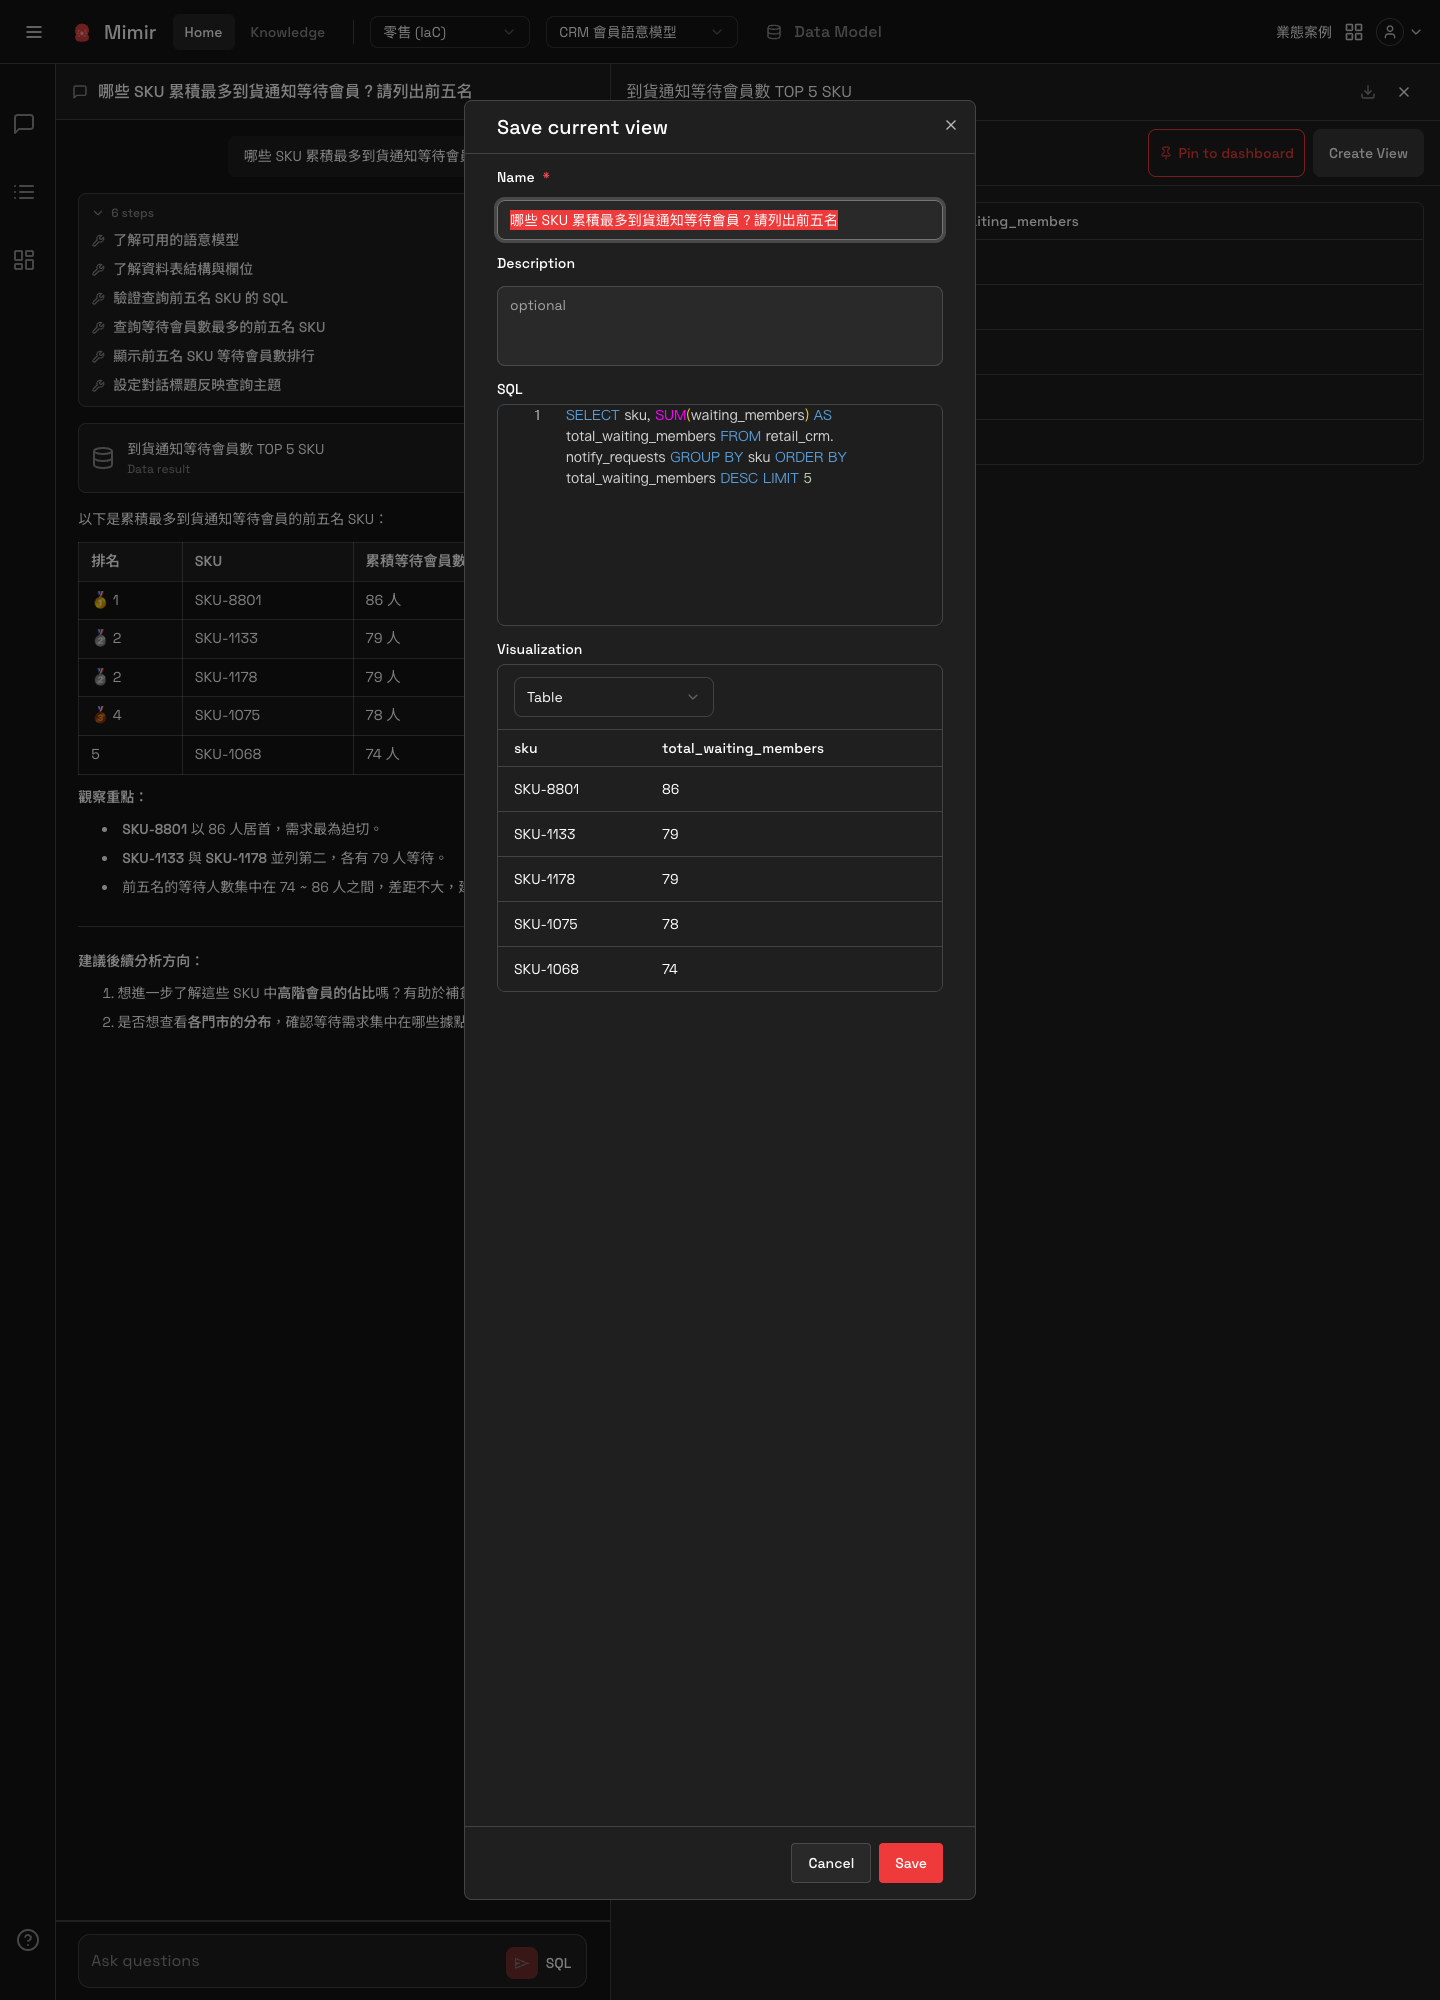
The dialog has four parts:
- Name: required. It is prefilled with the original question, which usually needs rewriting into something closer to a chart title.
- Description: optional. What this chart is tracking.
- SQL: the query behind the data, saved along with it.
- Visualization: the presentation to use. A live preview of your choice appears below. Press Save when it looks right.
Once saved, the View appears in the sidebar's Views section. The menu on each View in the sidebar offers rename and delete.
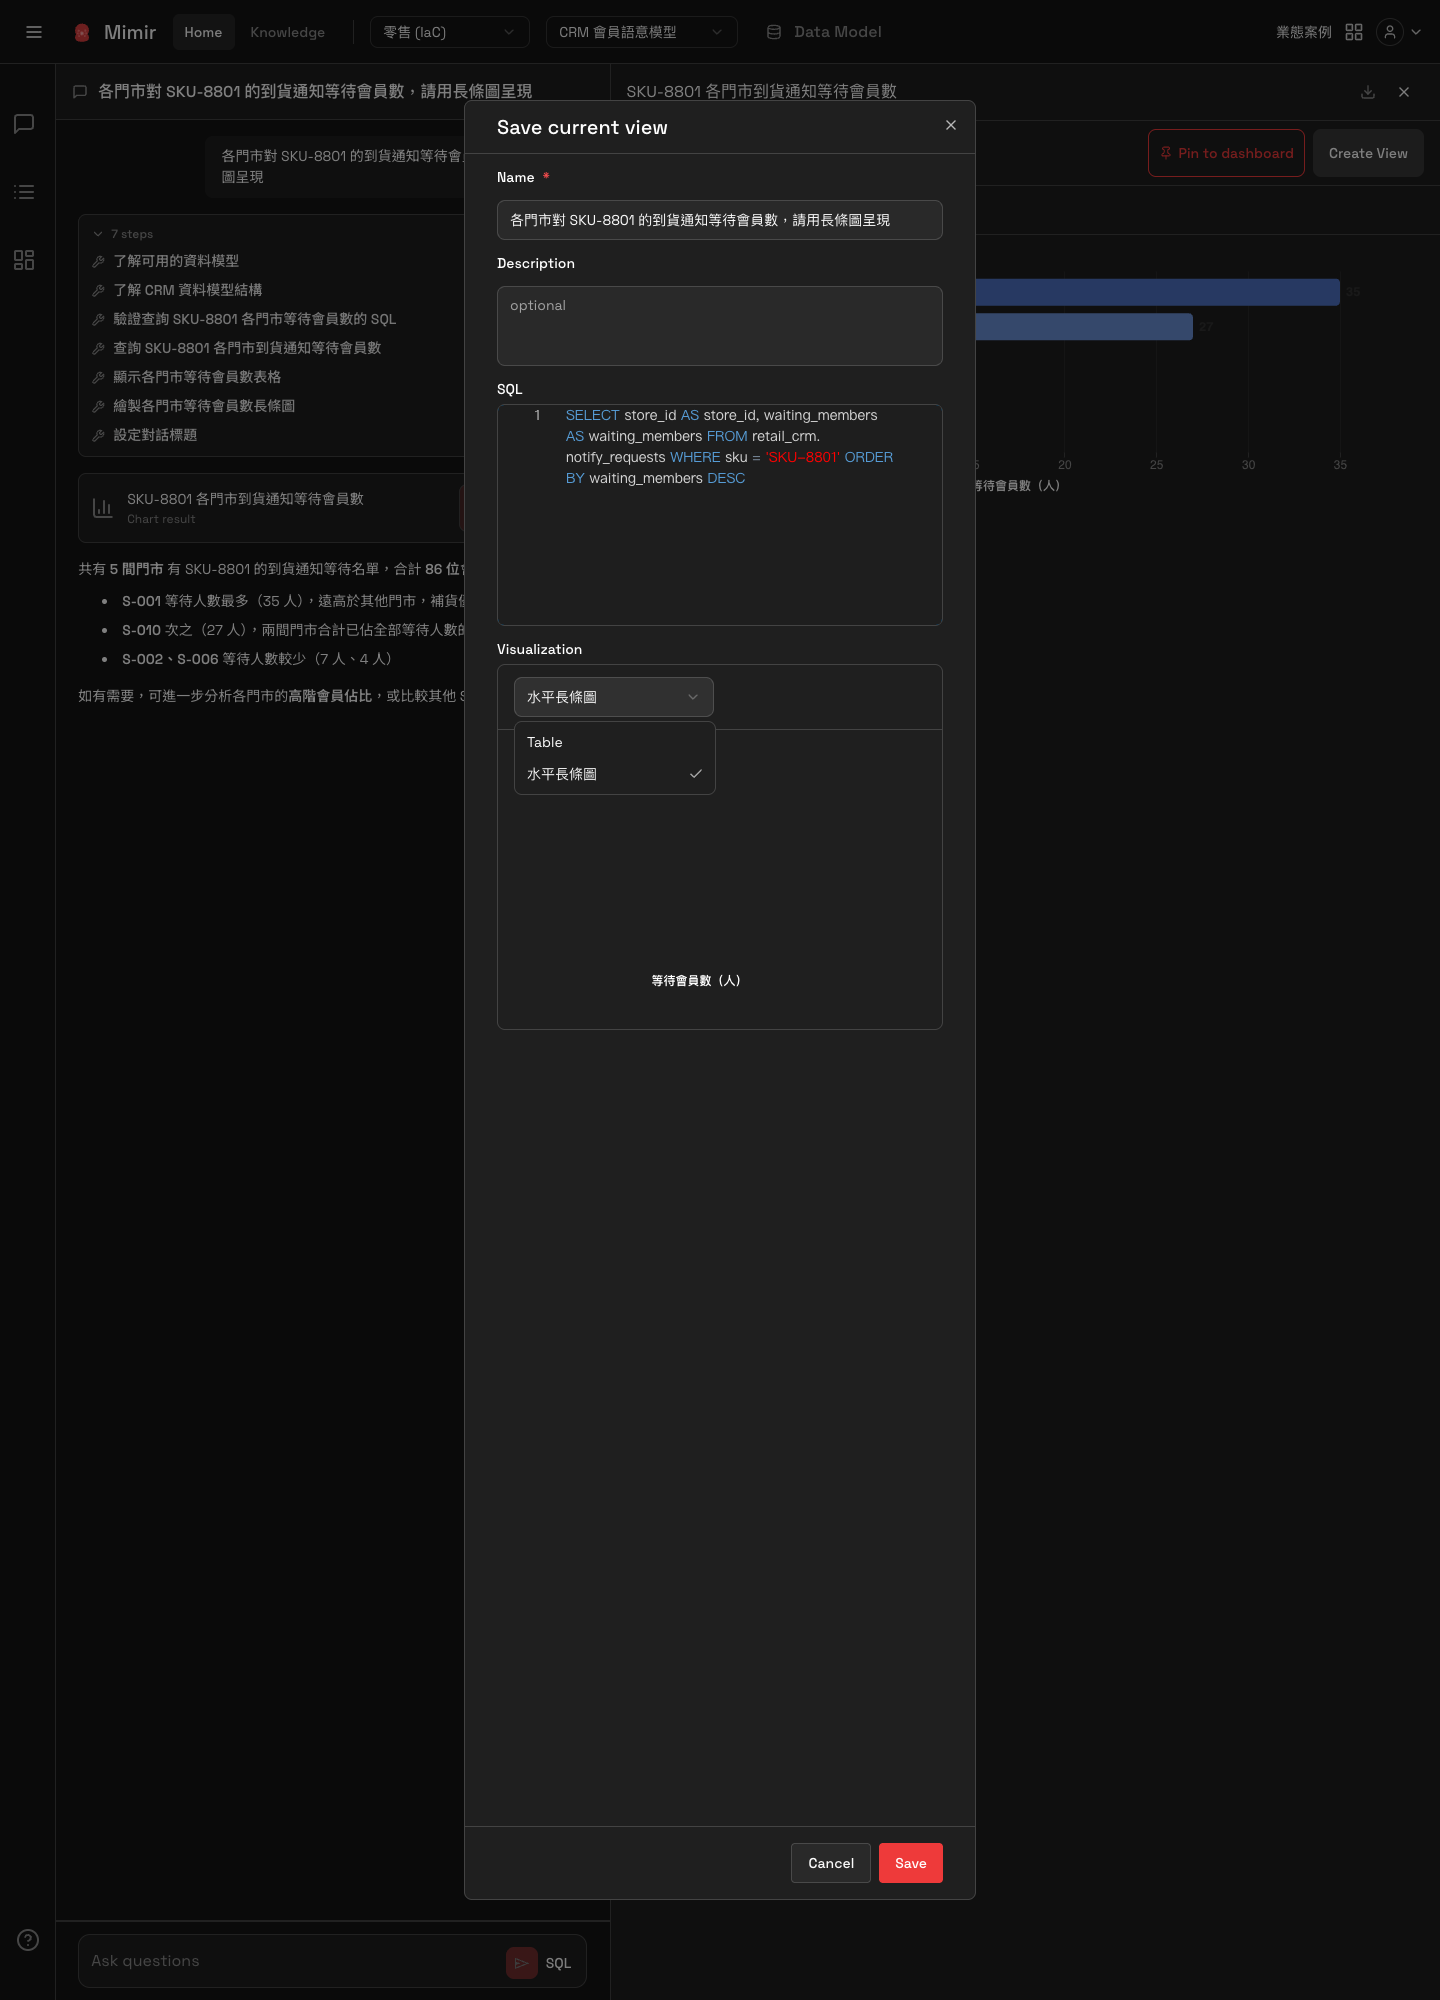
The available presentations depend on this answer
The Visualization dropdown always contains Table, plus one entry for every chart Mimir drew for this answer, named after that chart's type. So an answer that only produced a table offers nothing but Table. Ask for a chart when you ask the question, and there will be a chart to pick when you save.
The View detail page
Clicking any item under Views in the sidebar opens that chart's detail page. The column names shown here are the display names defined in the semantic model, presented alongside the original column names you see in Data Preview.
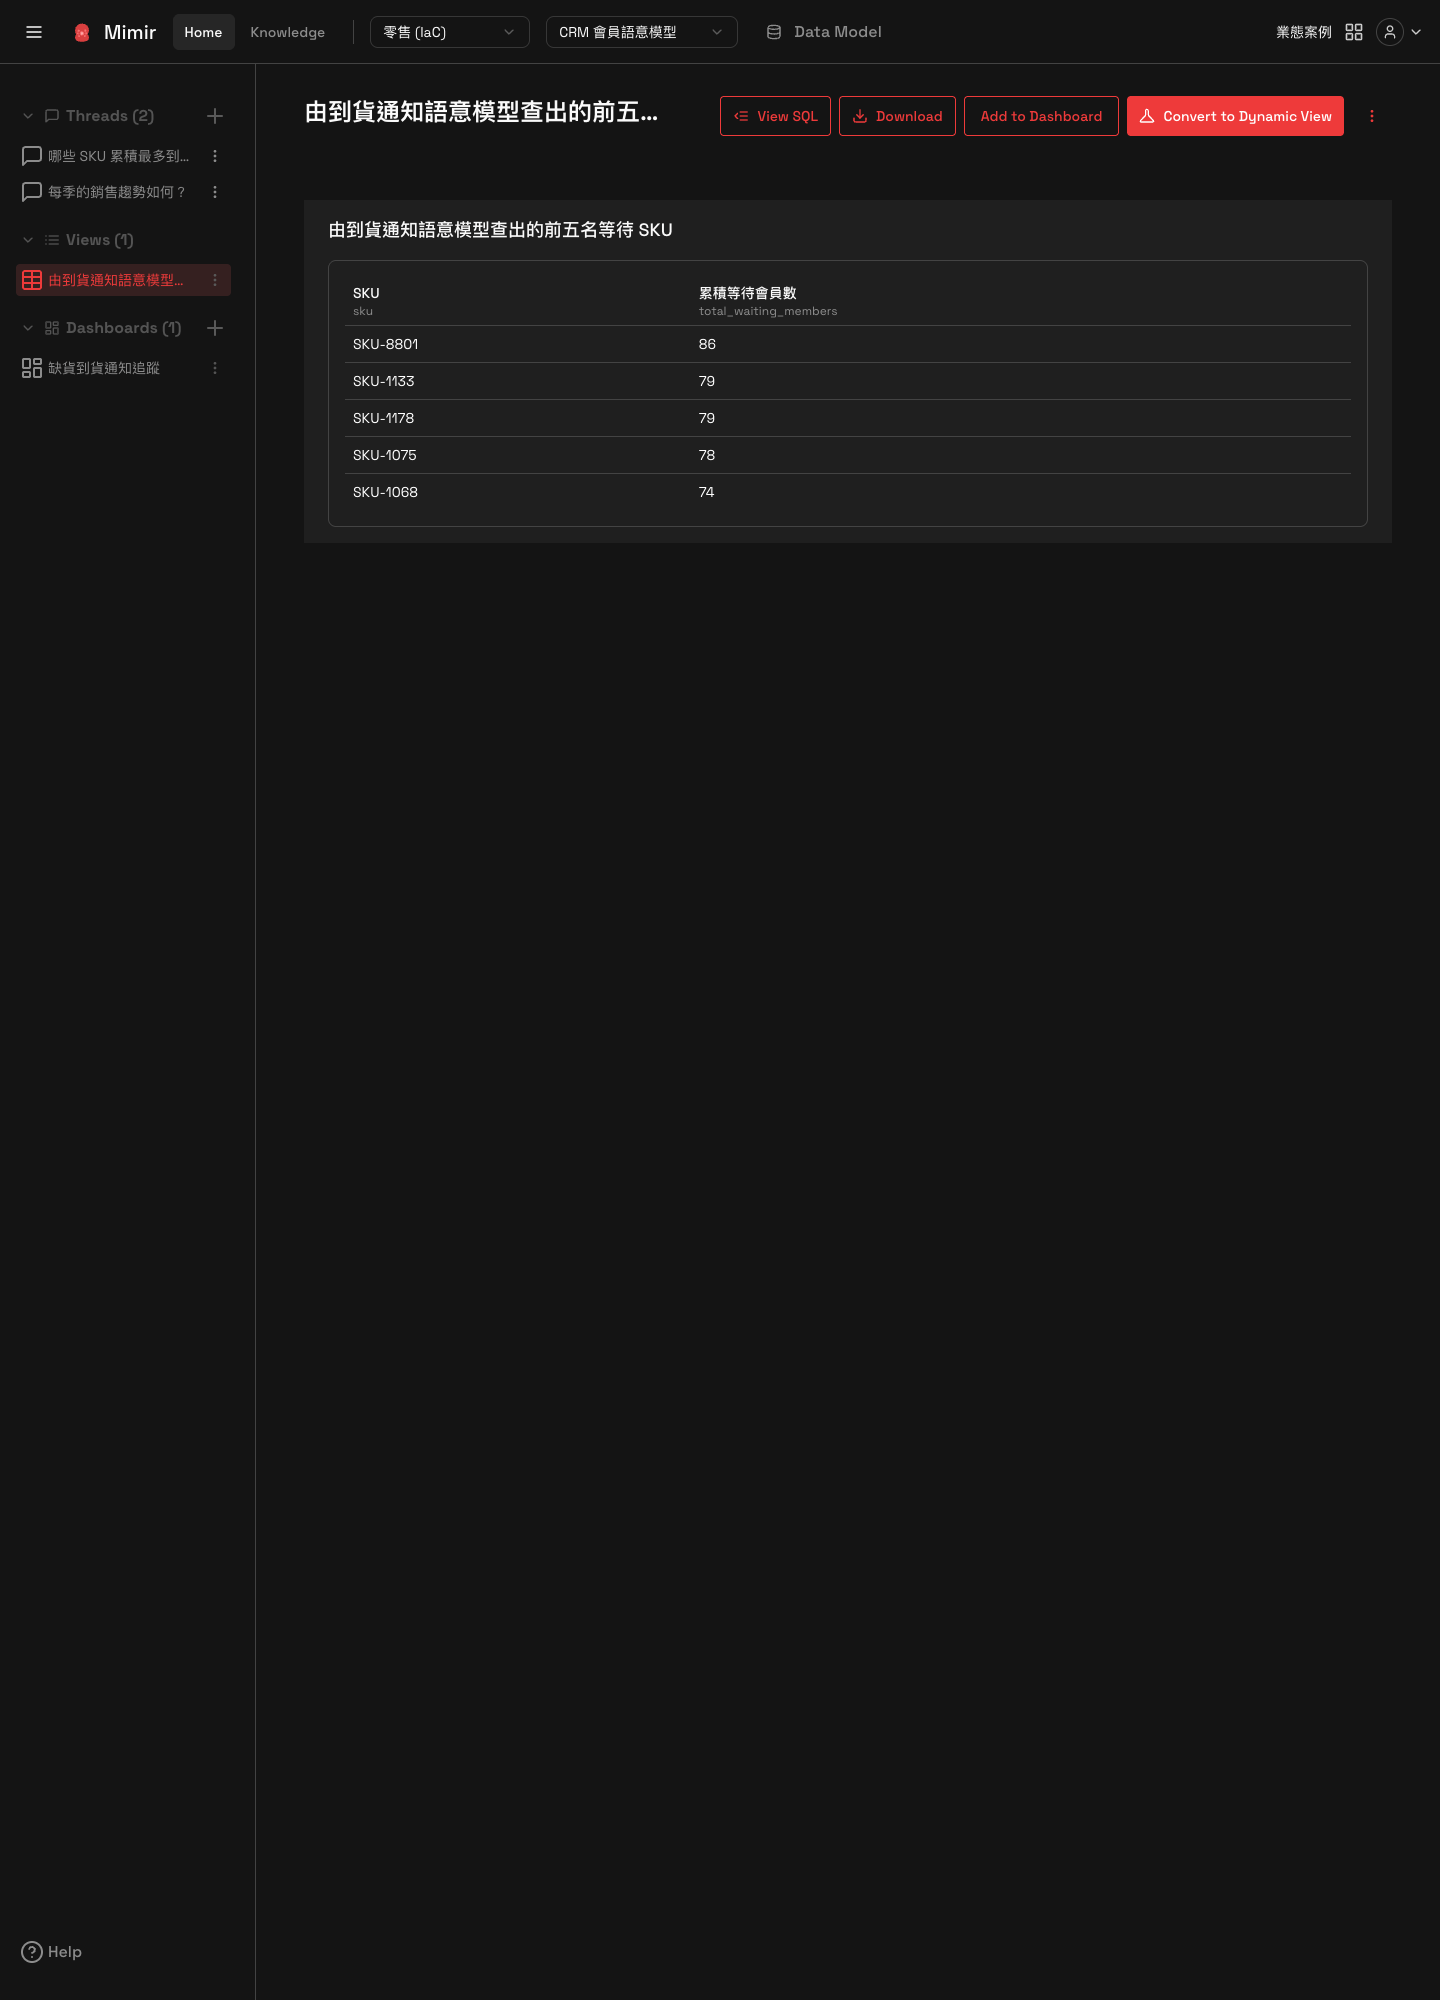
Four actions sit at the top of the page:
- View SQL: see the query behind this chart.
- Download: download the data.
- Add to Dashboard: add this chart to a dashboard. See Dashboard.
- Convert to Dynamic View: convert this chart into a dynamic one.
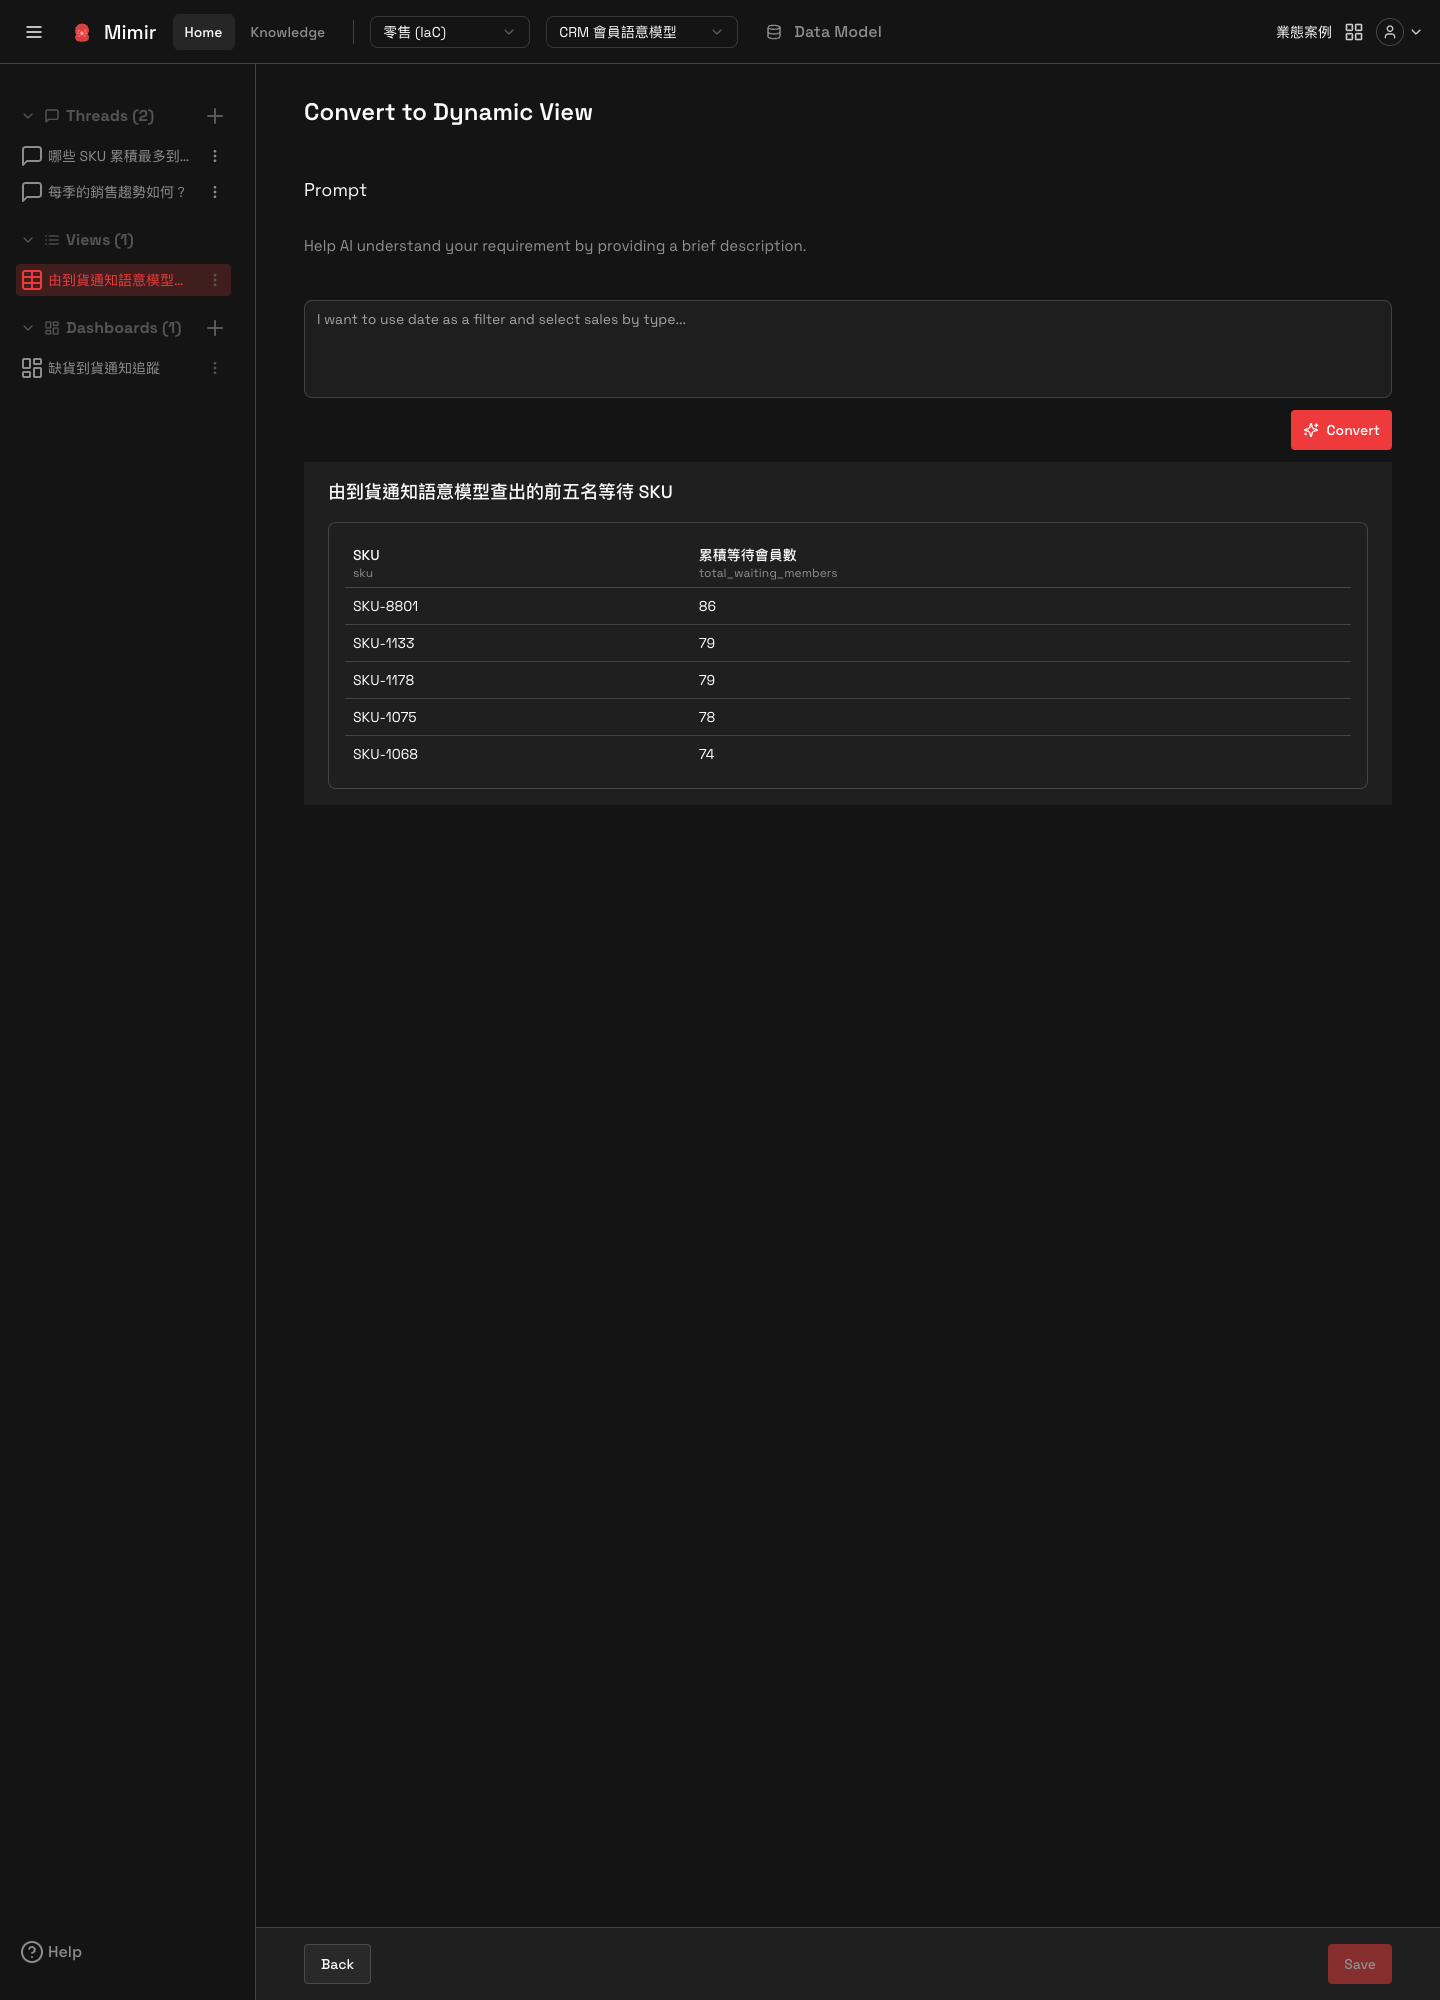
Converting to a Dynamic View
Clicking Convert to Dynamic View opens a conversion panel. At the top is a Prompt field whose helper text asks for a brief description of your requirement, to help the AI understand what to convert it into. Fill that in and press Convert to hand it to the AI. The current chart is shown below for comparison. Press Save to keep the result, or Back to go back.